Figure 6.
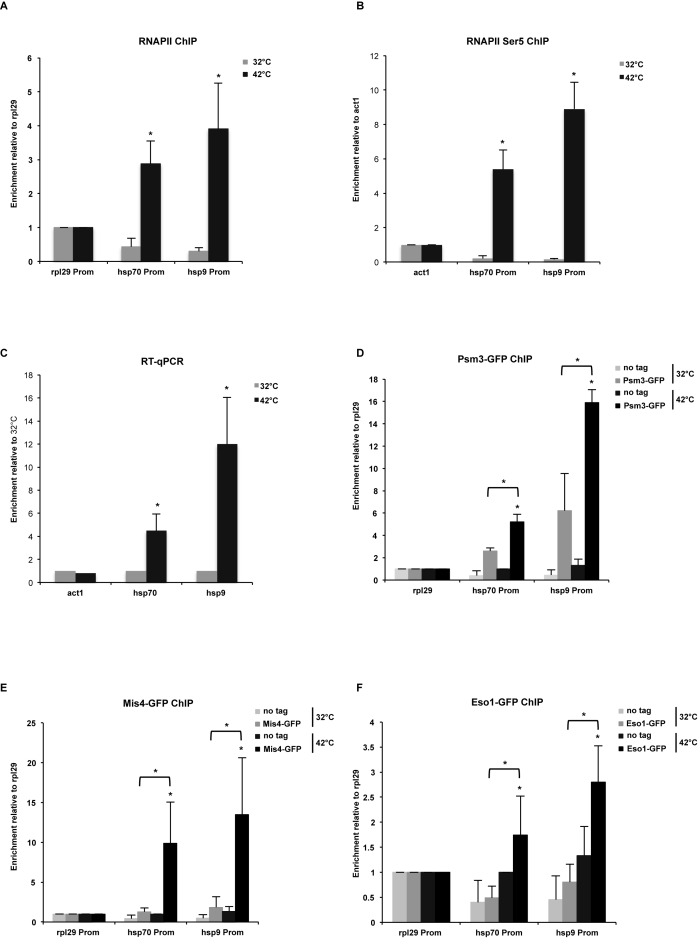
Transcription induction mediates cohesin proteins recruitment to chromatin. (A) ChIP-qPCR analysis showing RNAPII enrichment at selected promoters after heat shock at 42°C, 30 min. Values are normalized to rpl29. Error bars represent SD, n = 3. *P<0.05, one-tailed, paired Student's t-test comparing 42 to 32°C values. (B) ChIP-qPCR analysis showing enrichment of RNAPII phosphorylated at Ser5 at selected promoters after heat shock at 42°C, 30 min. Values are normalized to act1. Error bars represent SD, n = 3. * P<0.05, two-tailed, paired student's t-test comparing 42°C to 32°C values. (C) RT-qPCR showing act1, hsp70 and hsp9 mRNA levels after heat shock. Error bars represent SD, n = 3. Values are normalized to 32°C signals. *P < 0.05, two-tailed, paired Student's t-test comparing 42 to 32°C values. (D) ChIP-qPCR analysis showing Psm3-GFP enrichment at hsp70 and hsp9 promoters after shifting from 32 to 42°C, 30 min. Values are normalized to rpl29. Error bars represent SD, n = 3. *P < 0.05, one-tailed, paired Student's t-test comparing 42 to 32°C values and GFP signal to no tag control. (E) ChIP-qPCR analysis showing Mis4-GFP enrichment at hsp70 and hsp9 promoters after shifting from 32 to 42°C, 30 min. Values are normalized to rpl29. Error bars represent SD, n = 3. *P < 0.05, one-tailed, paired Student's t-test comparing 42 to 32°C values and GFP signal to no tag control. (F) ChIP-qPCR analysis showing Eso1-GFP enrichment at hsp70 and hsp9 promoters after shifting from 32 to 42°C, 30 min. Values are normalized to rpl29. Error bars represent SD, n = 3. *P < 0.05, one-tailed, paired Student's t-test comparing 42 to 32°C values and GFP signal to no tag control.

