Figure 7.
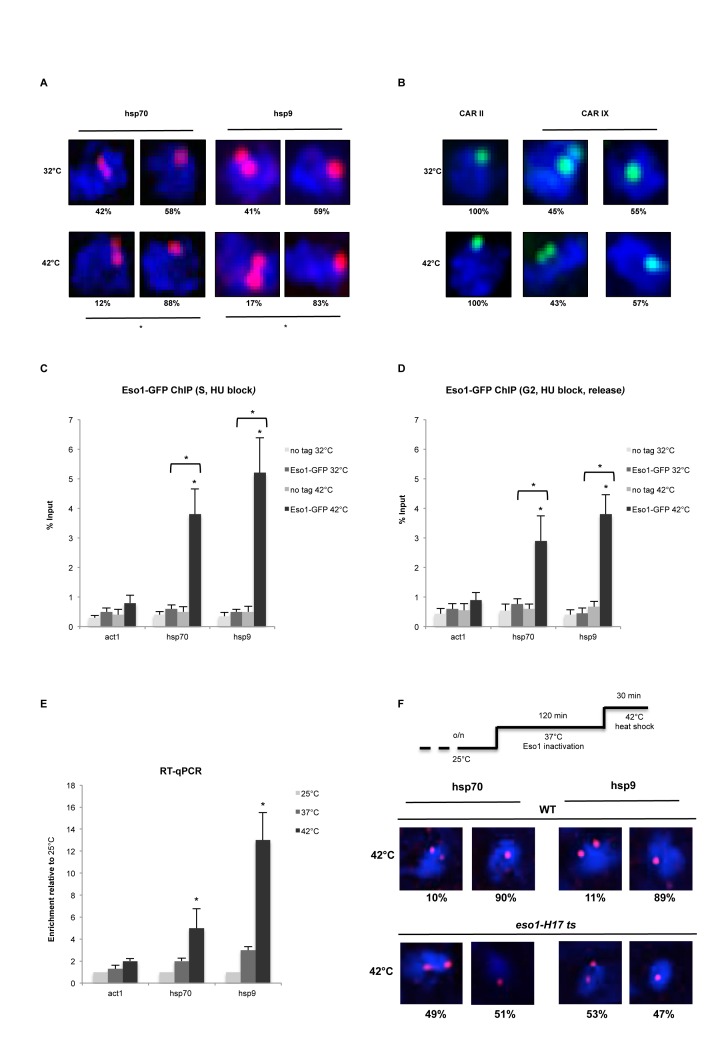
Transcription induction mediates cohesion establishment. (A) DNA FISH analysis of hsp70 and hsp9 loci. FISH probes (red dots, Alexa-555) are shown inside DAPI stained nucleus (blue). *P < 0.05. two-tailed, paired Student's t-test. n = 100 cells, two biological repeats. (B) DNA FISH analysis of CAR II and CAR IX used as controls for FISH after heat shock induction. 100% cohesion observed at CAR II between 32 and 42°C (left panel) and ±50% cohesion at CAR IX (same as in Figure 1B and C, respectively). n = 100 cells, two biological repeats. (C) ChIP-qPCR analysis showing Eso1-GFP enrichment at hsp70 and hsp9 loci in S synchronized cells (Hydroxyurea) after heat shock. No tag strain was used to assess the background levels. Error bars represent SD, n = 3. *P < 0.05, two-tailed, paired Student's t-test comparing 42 to 32°C values and GFP signal to no tag control. (D) ChIP-qPCR analysis showing Eso1-GFP enrichment at hsp70 and hsp9 loci in G2 synchronized cells (Hydroxyurea block and release) after heat shock. No tag strain was used to assess the background levels. Error bars represent SD, n = 3. *P < 0.05, two-tailed, paired Student's t-test comparing 42 to 32°C values and GFP signal to no tag control. (E) RT-qPCR showing act1, hsp70 and hsp9 mRNA levels at 25, 37 and 42°C. Error bars represent SD, n = 3. *P < 0.05, two-tailed, paired Student's t-test comparing 42 to 25°C values. (F) DNA FISH analysis of hsp70 and hsp9 loci in WT and eso1-H17 cells. Cells were grown o/n at 25°C. Eso1 was inactivated at 37°C for 2 h, followed by heat shock at 42°C.

