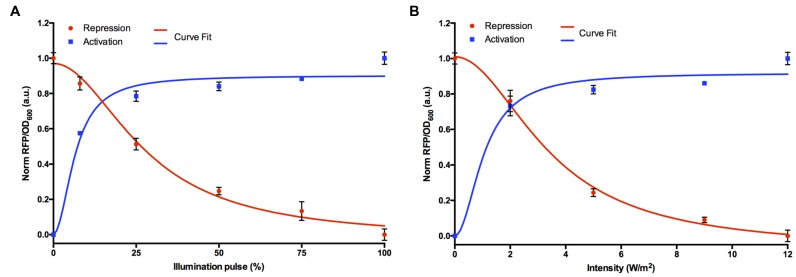
Figure 2.
Dose-response curves of blue light inducible and repressible promoters. (A) Varying blue light illumination pulse (%), 0% (OFF), 8.33% (5 s ON; 55 s OFF), 25% (15 s ON; 45 s OFF), 50% (30 s ON; 30 s OFF), 75% (45 s ON; 15 s OFF) and 100% (ON). (B) Varying blue light intensity levels (2, 5, 9 and 12 W/m2). The curve-fits are shown as solid lines to the promoter transfer function. All data (RFP/OD600) were normalized to the highest value obtained. The error bars indicate S.D. (n = 3).

