Figure 1.
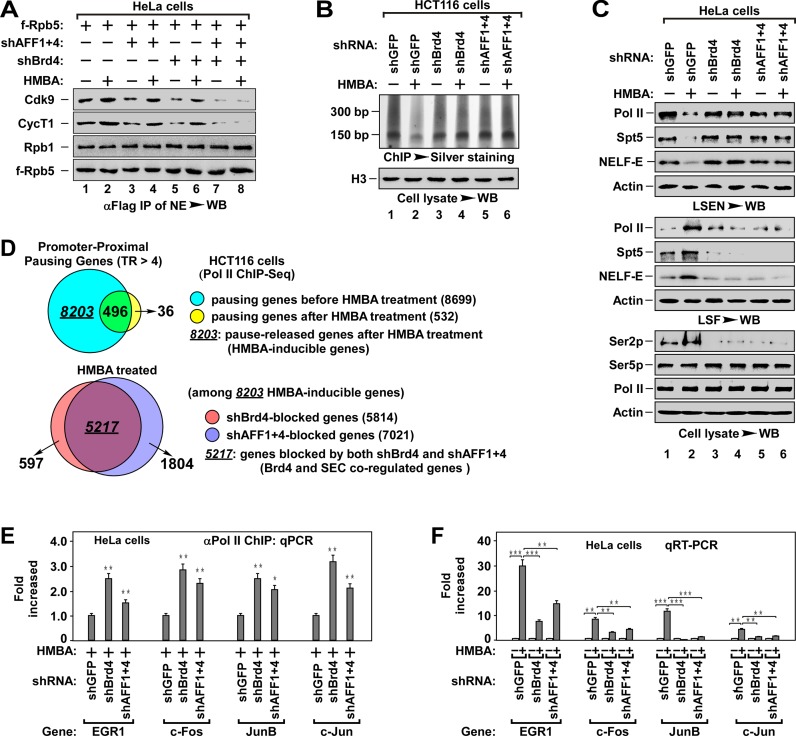
Brd4 and SEC cooperatively regulate promoter–proximal pausing release. (A) The anti-Flag IPs derived from NEs of HeLa cells with indicated f-Rpb5 cDNA and shRNA(s) co-transfection and HMBA treatment were analyzed by WB for the levels of Pol II-associated P-TEFb. The f-Rpt5-bound Rpb1 was also tested to indicate the levels of intact Pol II. shAFF1+4: shAFF1+shAFF4. (B) ChIP-Silver staining assay for the effect of Brd4 or AFF1+4 knockdown on the accumulation of Pol II on genomic DNA. The Pol II-bound genomic DNAs from HCT116 cells with indicated shRNA(s) infection and HMBA treatment were chromatin-immunoprecipitated (ChIPed), followed by PAGE resolving and silver staining assay for the accumulation of Pol II on chromatin (top). The histone H3 in cell lysates was examined by WB as a loading control (bottom). (C) WB analysis for the effect of Brd4 or AFF1+4 knockdown on HMBA-induced pause release of Pol II. The low-salt extracted nuclei (LSEN), top, low-salt fraction (LSF), middle and cell lysates (bottom) were prepared from HeLa cells with indicated shRNA(s) infection and HMBA treatment. (D) The ChIPed DNAs in (B) were subjected to high-throughput sequencing analysis. Venn diagrams display the proportion of promoter–proximal pausing genes before and after HMBA treatment (top) and the proportion of Brd4 or AFF1+4 knockdown-induced pausing genes among the 8203 HMBA-inducible genes under HMBA treatment. Pausing gene: TR > 4.0, P-value < 0.005. (E) The Pol II-bound genomic DNAs were ChIPed from HeLa cells with indicated shRNA(s) infection and HMBA treatment were analyzed by qPCR for the enrichment of Pol II on promoter region of representative genes. The level in shGFP infected cells was set to 1.0. All values were expressed as Mean ± SD of three replicates. *P < 0.05, **P < 0.01; P-values were assessed using two-tailed Student's t-test. (F) Total RNAs isolated from HeLa cells with indicated shRNA(s) infection and HMBA treatment were analyzed by qRT-PCR for mRNA levels of representative genes with primers matching elongation region. The level in untreated cells was set to 1.0. All values were expressed as Mean ± SD of three replicates after normalized to actin. **P < 0.01, ***P < 0.001; P-values were assessed using two-tailed Student's t-test.

