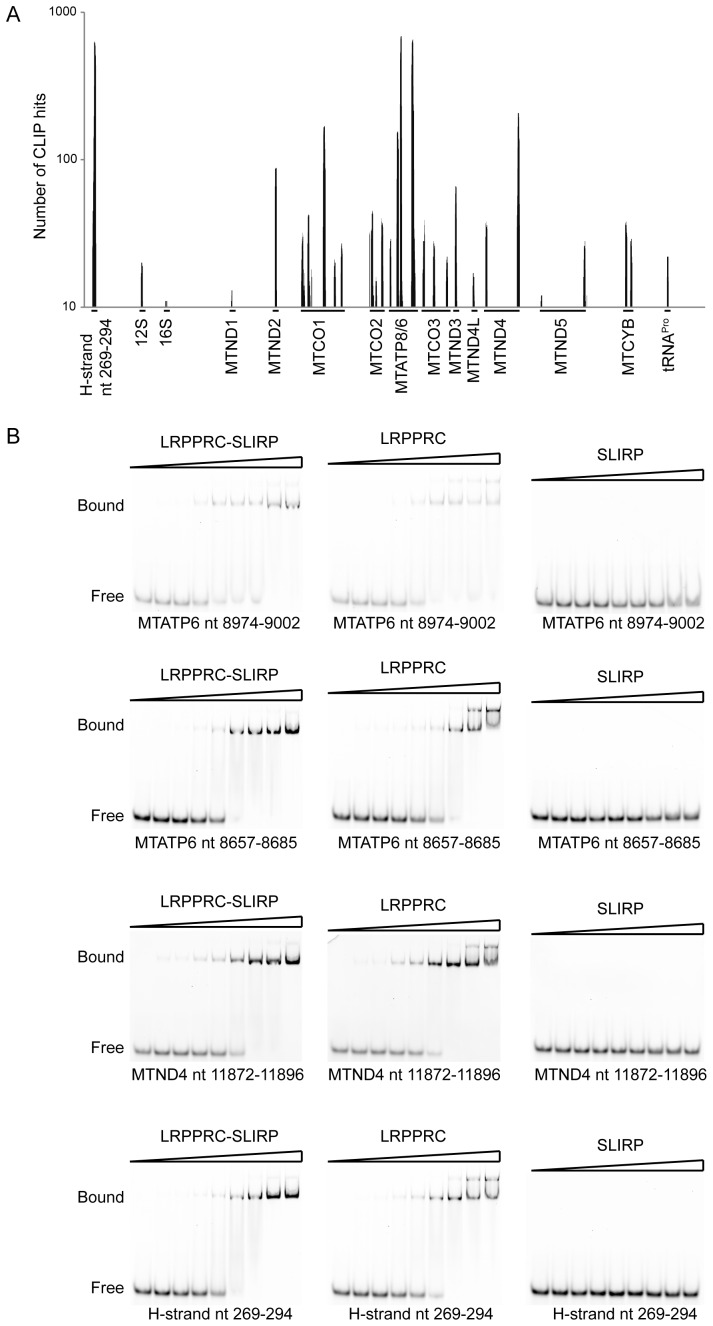
Figure 2.
RNA binding by LRPPRC, SLIRP and the LRPPRC–SLIRP complex. (A) CLIP analysis of SLIRP. The number of CLIP hits is shown on the y-axis and identified targets on the x-axis. (B) REMSA of LRPPRC–SLIRP, LRPPRC or SLIRP. RNA template sequences are indicated. Protein concentrations used were 0, 0.02, 0.04, 0.08, 0.16, 0.36, 0.64, 1.28, 2.56 μM, respectively.

