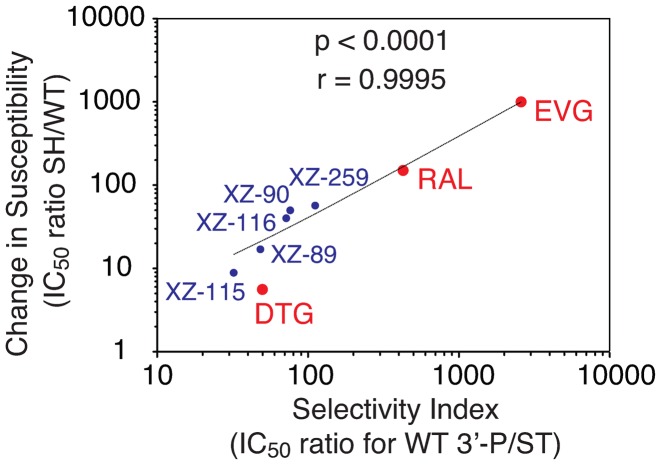
Figure 6.
Correlation between the selectivity of different INSTIs for ST over 3′-P and the change in susceptibility induced by the SH resistance mutant. The selectivity index was calculated as the IC50 for 3′-P for each compound divided by the corresponding IC50 for ST in the context of WT IN. Change in susceptibility was calculated as the IC50 for ST for each compound in the context of the SH mutant divided by the corresponding IC50 in the context of WT IN. Linear regression and statistical analyses including P-values and Pearson correlation (r) are indicated.

