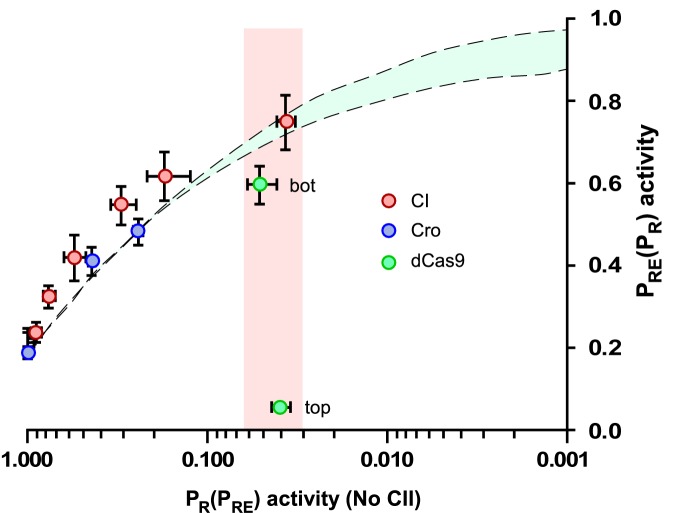
Figure 6.
Relief of TI is modulated by the intrinsic properties of the repressors. Relief of TI is plotted as PRE versus PR activity (in the absence of CII). Data on relief of TI by CI is from Figure 3C and D, and dCas9 from Figure 5C and D. Relief of TI at PRE by Cro repression of PR was measured with Cro expressed either from the chromosomal LacZ reporter itself (1xcro) or from the reporter and additionally from a second chromosomal PR.cro expression construct (2xcro) (see main text for details). Vertical and horizontal error bars are 95% confidence intervals in PRE and PR activity, respectively (n = 9 for CI and dCas9, n = 6 for Cro). Cyan shaded region shows simulated PRE activity at different magnitude of PR repressions for fast kinetics repressors of PR, kU = 0.5 s–1 with either strong or weak barrier parameters (Figure 2).

