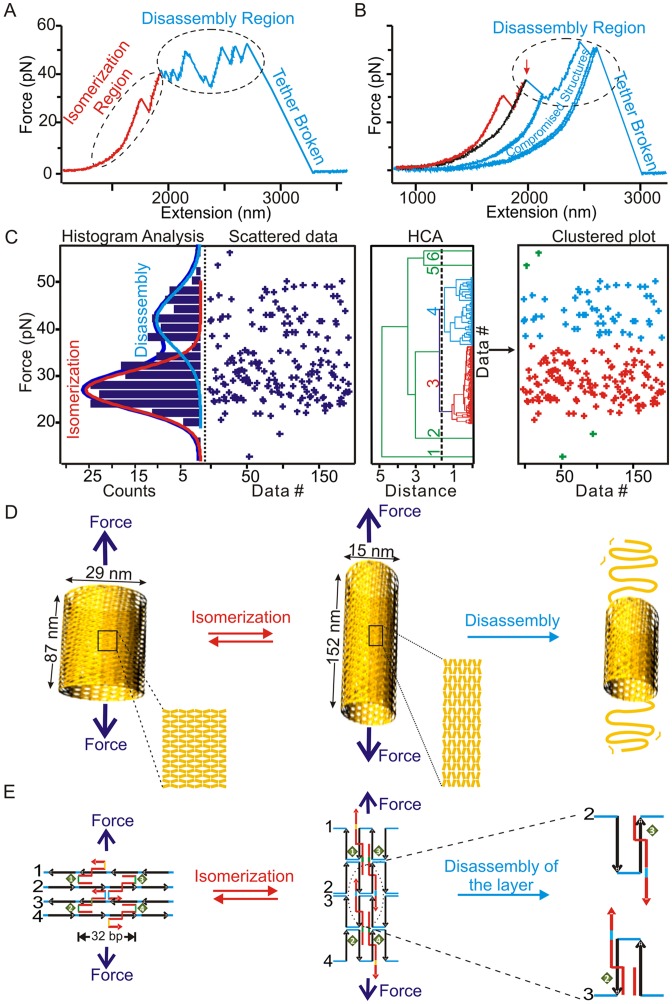
Figure 2.
Mechanochemical properties of DNA origami tubes. (A) A typical force–extension (F–X) trace for the longitudinal stretching of a eight-tube DNA in optical tweezers experiment. Dotted circles depict the isomerization and disassembly processes. (B) A set of F–X traces for another eight-tube DNA origami. The first transition event in the red curve depicts mechanical isomerization. The relaxing curve after mechanical isomerization is shown in black. After incubation, the next stretching curve is identical with the first red curve. After mechanical disassembly, the traces do not overlap with the first red curve after incubation at 0 pN. Instead, they depict longer contour lengths (blue). (C) Distribution plots for the transition forces (left two panels) and the hierarchical cluster analyses (right two panels) clearly indicate the presence of two populations. The red population with lower transition force is due to isomerization of the nanotube while the blue population with higher transition force is due to nanotube disassembly. Solid curves in the left panel represent Gaussian fittings. The green data points are identified as stand-alone groups in HCA. We assigned these points to each of the populations based on force. (D) Schematic of mechanical isomerization of the short to long eight-tube DNA origami structures followed by disassembly. Magnified sections show the rearrangement of Holliday junctions before and after mechanical isomerization. (E) Schematic of the molecular rearrangements of Holliday junctions in a DNA tube during mechanical isomerization and disassembly processes. Numbers in black and green respectively indicate the duplex layers and the Holliday junctions in DNA origami tubes.

