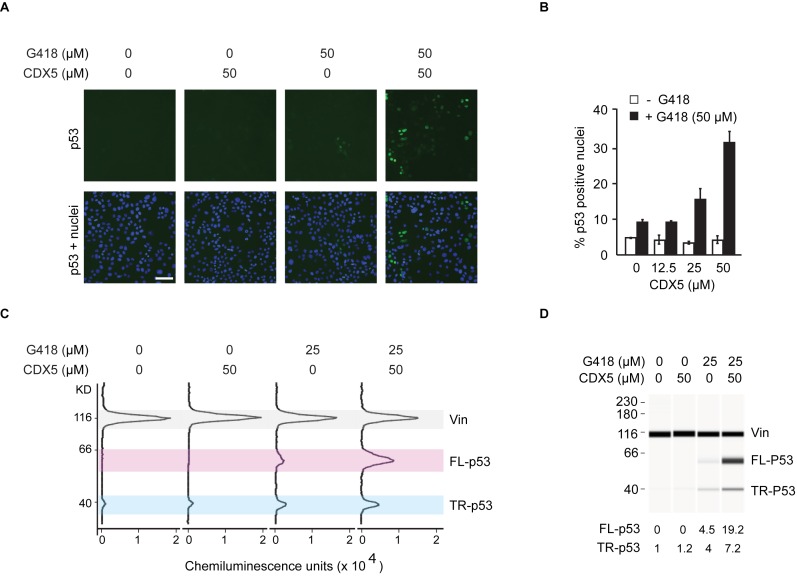
Figure 2.
PTC readthrough at p53 R213X in HDQ-P1 human breast carcinoma cells. (A and B) Automated p53 immunofluorescence microscopy assay. Cells grown in 96-well plates were exposed for 72 h to different concentrations of CDX5 without or with 50 μM G418. The proportion of cells showing nuclear p53 immunofluorescence was determined as an indirect but high throughput measure of PTC readthrough. Representative images are shown in (A), with p53 immunofluorescence shown in green and nuclei in blue (bar, 100 μm). Quantitative data are shown in (B) (mean ± S.D., n = 3). Additional images are shown in Supplementary Figure S2. (C) Automated capillary electrophoresis western analysis. Cells were exposed for 96 h to the indicated compounds. The results are electropherograms of the chemiluminescence detection of bound antibodies. TR-p53: truncated p53, FL-p53: full-length p53, Vin: vinculin loading control. (D) The results from panel C are displayed as ‘pseudo blots’ for ease of visualization. The area under the truncated and full-length p53 peaks was first normalized to the vinculin loading control to account for variations in protein loading. To provide lane-to-lane comparison, the amount of truncated and full-length p53 was further divided by the amount of truncated p53 found in untreated cells. These numbers are displayed under the lanes. The data show that CDX5 does not induce the formation of full-length p53 as a single agent but that it strongly potentiates the PTC readthrough activity of G418.

