Figure 4.
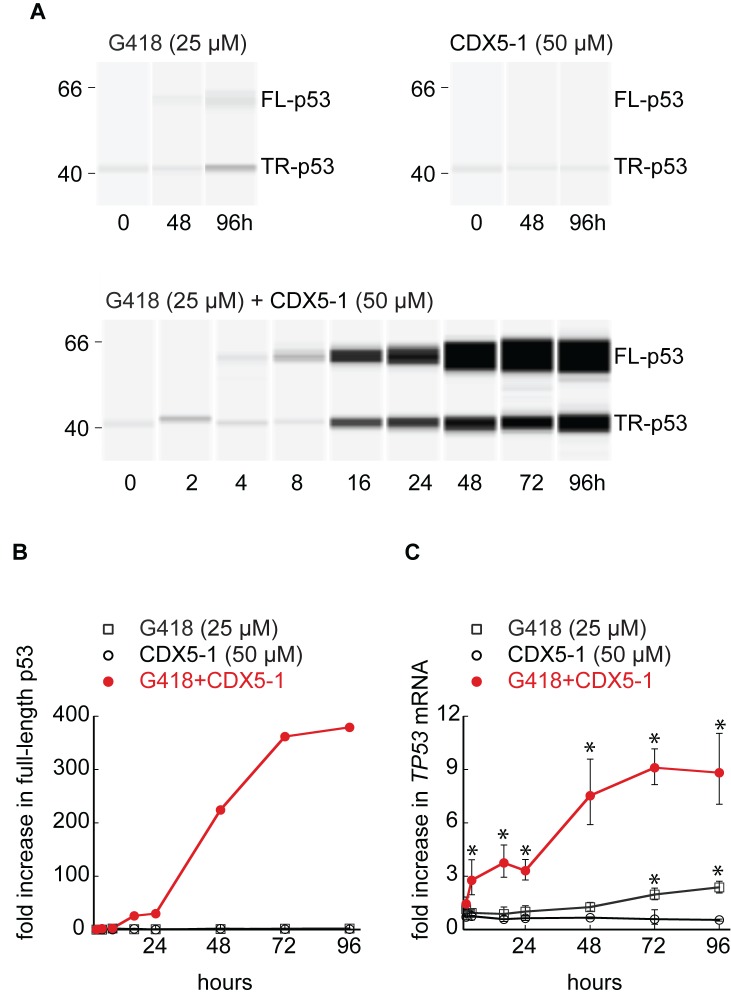
Time course of PTC readthrough. HDQ-P1 were exposed to compounds for different times and analysed for formation of full-length p53 (A and B), and TP53 mRNA (C). Panel A shows representative time points for G418 and CDX5-1 and the entire time course for the combination of G418 and CDX5-1. Panel B shows quantitation of full-length p53 relative to the amount of truncated p53 found in untreated cells for the entire time course for all three treatments. Panel C shows triplicate measurements of TP53 mRNA (± S.D., n = 3) from the same samples as panels A and B. * indicates statistically significant differences between different treatment conditions and untreated samples (P < 0.05).

