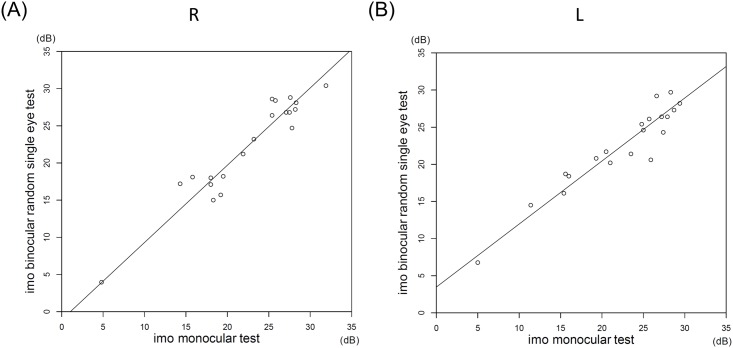
Fig 7. Correlations between the MS values for the right and left eyes by the two imo tests.
The MS values by the two imo tests highly correlated for the two eyes (R: r = 0.96, L: r = 0.95, P < 0.001). The slopes of the Deming regression lines were 1.04 (95% CI, 0.89 to 1.26) for the right eye and 0.85 (95% CI, 0.71 to 0.95) for the left eye. The intercepts were -1.09 (95% CI, -6.30 to 2.66) for the right eye and 3.47 (95% CI, 0.92 to 6.35) for the left eye.

