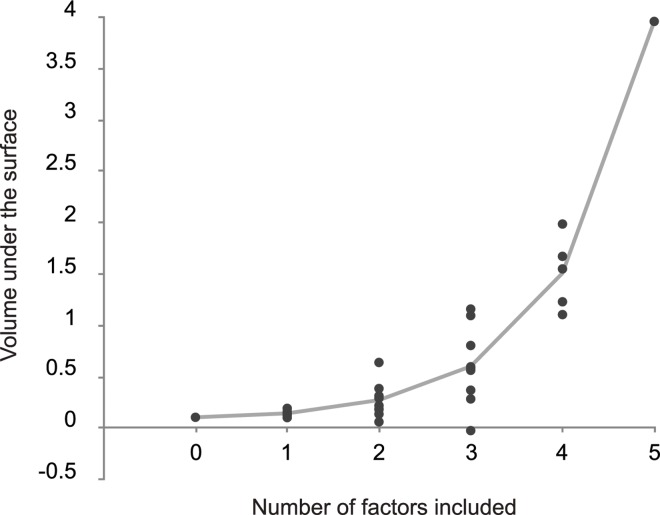
Fig 14. Volume under the surface for all 32 tasks generated by the 5 binary factors discussed in this paper.
Each dot represents the volume under the surface of linear regression coefficients for one task, and is plotted as a function of the number of ‘beneficial’ factors that are included in each task’s design. The gray line represents the average increase in the strength of the relationship between model-based control and reward.

