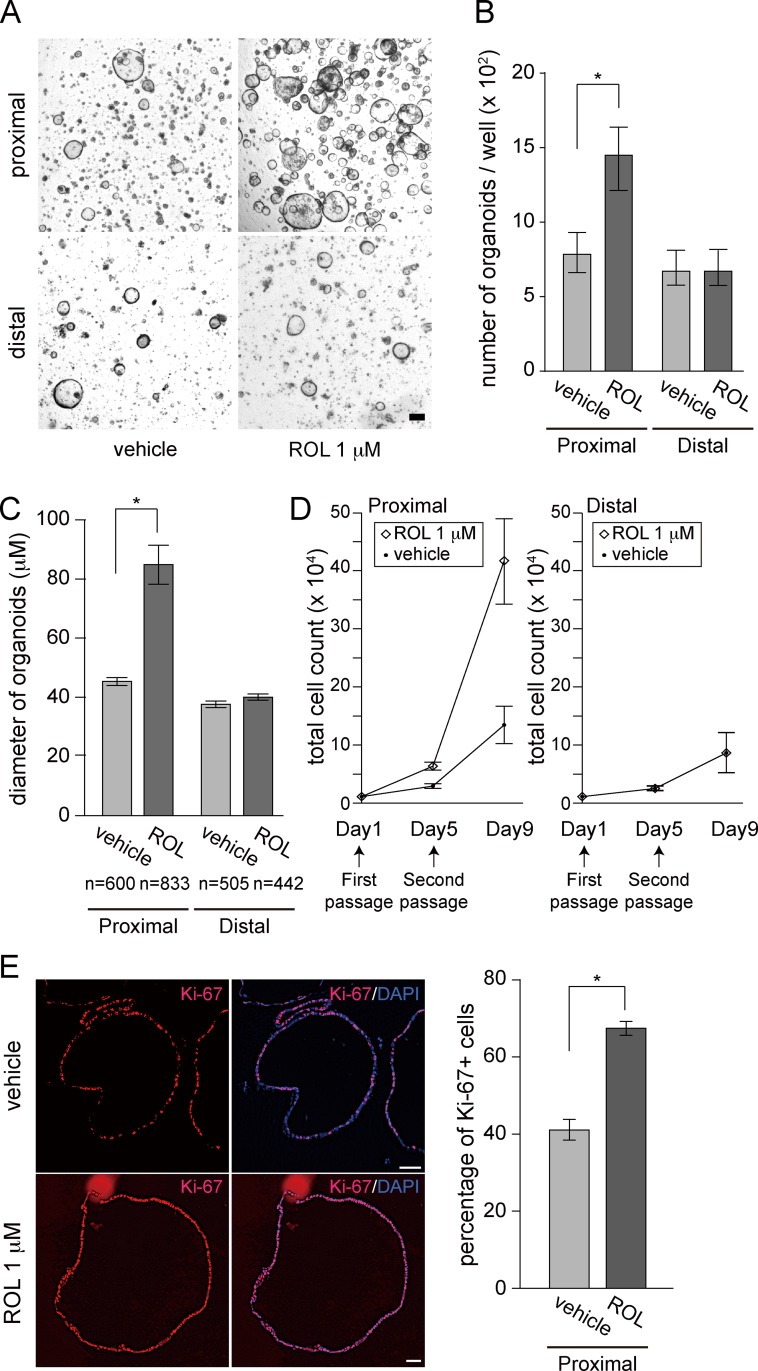
Fig 3. ROL enhances growth of proximal colon organoids but not of distal ones.
(A) Proximal and distal colon organoids were separately subjected to single-cell passage. Respective cells were cultured in the absence (vehicle) or presence of ROL (1 μM) and phase-contrast images were acquired on Day 5. Representative images of three independent experiments are shown. Scale bar, 100 μm. (B) Single-cell passage and the following culture was initiated as in (A) at a density of 1 x 10⁴ cells/well. On day 5, round cystic organoids that formed in each well were counted as described in Materials and Methods. Values are presented as mean ± s.e.m. (n = 9). *, P < 0.05. (C) Proximal and distal colon cells were cultured as in (B). Diameters of organoids were measured on Day 5 of culture as described in Materials and Methods. Total number (n) of organoids analyzed in each group was shown at the bottom. Data are presented as mean ± s.e.m. (n = 9). *, P < 0.05. (D) Proximal and distal colon cells were cultured as in (B) at a density of 1 x 10⁴ cells/well (Day1). Triplicate wells from one of three independent donor samples were separately cultured. On Day 5, organoids were recovered and then the second passage was performed. Cell numbers were counted on Day 5 (at the time point of second passage) and Day 9. Data are presented as mean ± s.e.m. (n = 9). *, P < 0.05. (E) Proximal colon cells were cultured as in (B). On Day 5, frozen sections of organoids were subjected to immunohistochemistry for Ki-67 (left). Merged images with DAPI staining were also shown (right). Scale bars, 50 μm. The percentage of Ki-67+ cells to whole cell populations was quantitated (graph on the right) as described for Fig 2D. Values are presented as mean ± s.e.m. for those 270 sections. *, P < 0.05.

