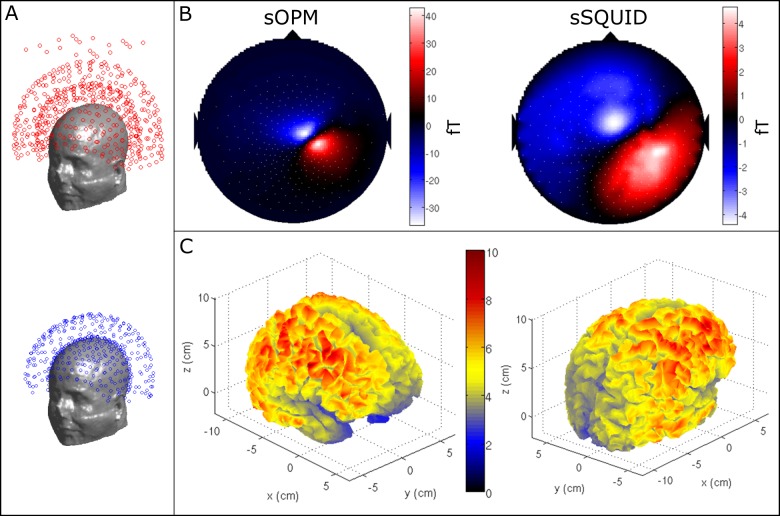
Fig 3. SNR simulation.
(A) Simulation set-up; the upper panel shows the coil arrangement for the sSQUID system, based on the axial gradiometer configuration of the 275 channel CTF MEG instrument. The lower panel shows our sOPM system; note 5 cm baseline axial gradiometers are used to allow a direct comparison of the sSQUID and sOPM systems. (B) Simulated magnetic field from a single dipole located in the parietal lobe. Note the increased magnitude and more focal nature of the measured magnetic field patterns. (C) The ratio of the Frobenius norms of the forward fields, plotted as a function of dipole location on the cortex. The colours represent the quantity fj,OPM/fj,SQ; i.e. a ratio of 5 would indicate a fivefold improvement in SNR of the sOPM compared to the sSQUID system (assuming equal noise floors). The left and right panels show different aspects of the same data.

