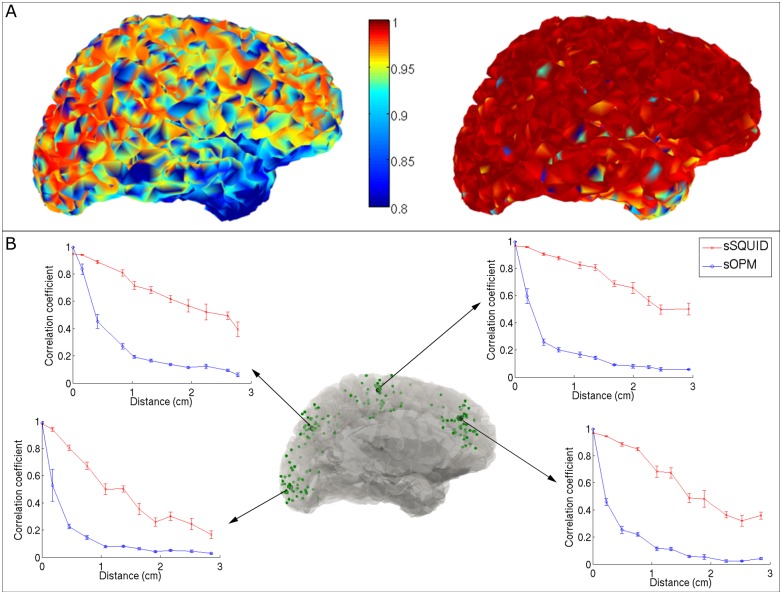
Fig 4. Reconstruction accuracy.
(A) The left hand panel shows beamformer reconstruction accuracy for the sSQUID system. The right hand panel shows beamformer reconstruction accuracy for the sOPM system. In both cases reconstruction accuracy is measured as temporal correlation between the simulated and reconstructed dipole time courses. Colours represent the quantities rSQ(qj,q̂j) and rOPM(qj,q̂j) for left and right panels, respectively. Note the improvement for the sOPM system. (B) Spatial reconstruction accuracy around four cortical locations (in black). The four inset graphs show correlation coefficients between the original simulated time course and reconstructed dipole time courses at the simulated source location and its nearest neighbours (shown in green on the central image). Correlation is plotted as a function of Euclidean distance to the simulated dipole. Note that for both systems, correlation is maximal closest to the simulated source, however correlation falls off more quickly with distance for the sOPM system, indicating a better spatially resolved image.

