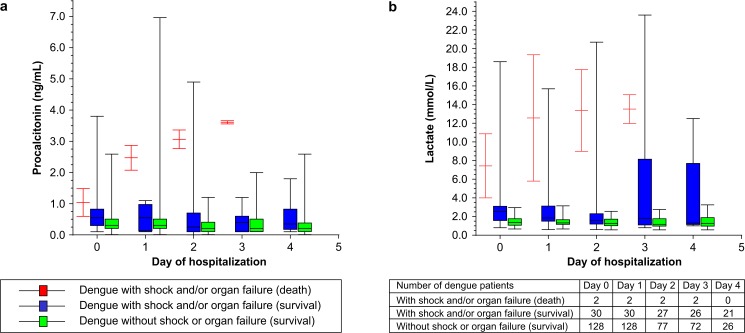
Fig 4. Daily changes in serum procalcitonin and peripheral venous lactate during hospitalization.
(A) Changes in average serum procalcitonin (ng/mL) levels among patients with and without dengue shock and/or organ failure by survival status. (B) Changes in peripheral venous lactate (mmol/L) levels among patients with and without dengue shock and/or organ failure by survival status. Data are presented as box and whisker plots with median (horizontal line), interquartile range (box), and maximum value within 1.5 of interquartile range (whiskers).

