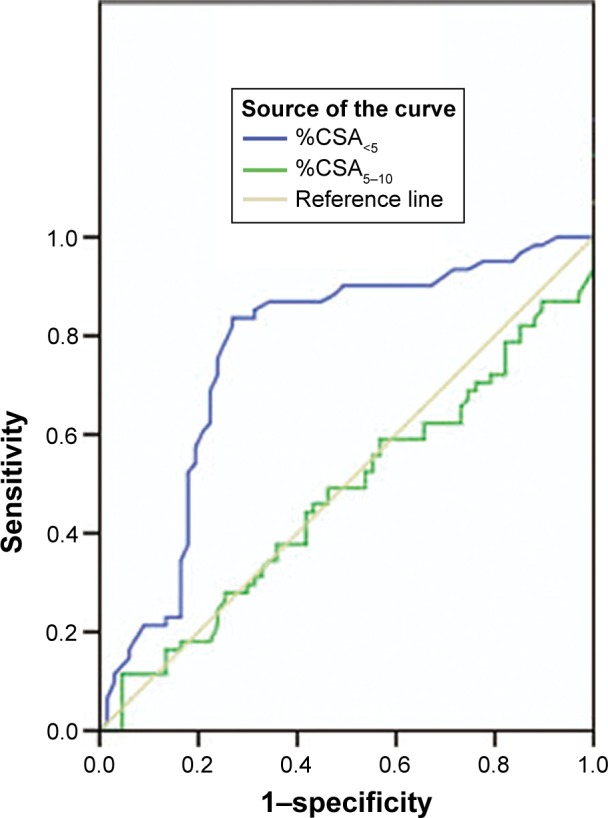
Figure 2.

ROC analyses of parameters for the prediction of AECOPD. Note: AUC was highest for %CSA<5 (AUC =0.764, 95% CI =0.677–0.851).
Abbreviations: AUC, area under the curve; AECOPD, acute exacerbations of chronic obstructive pulmonary disease; CI, confidence interval; %CSA<5, percentage of total lung area taken up by the cross-sectional area of pulmonary vessels less than 5 mm2; %CSA5–10, percentage of total lung area taken up by the cross-sectional area of pulmonary vessels between 5 and 10 mm2; ROC, receiver operating characteristic.
