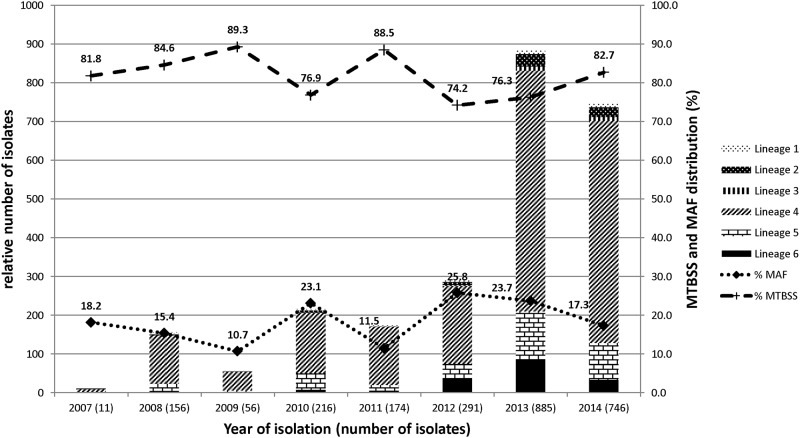
Fig 3. Temporal distribution and prevalence of human adapted mycobacterium tuberculosis complex (MTBC).
Figure displays a stacked graph showing the temporal distribution of human adapted MTBC (left y-axis) and a linear graph showing the prevalence of Mycobacterium tuberculosis sensu stricto (MTBss) and Mycobacterium africanum (Maf) (right y-axis) over the entire 8-year study period.

