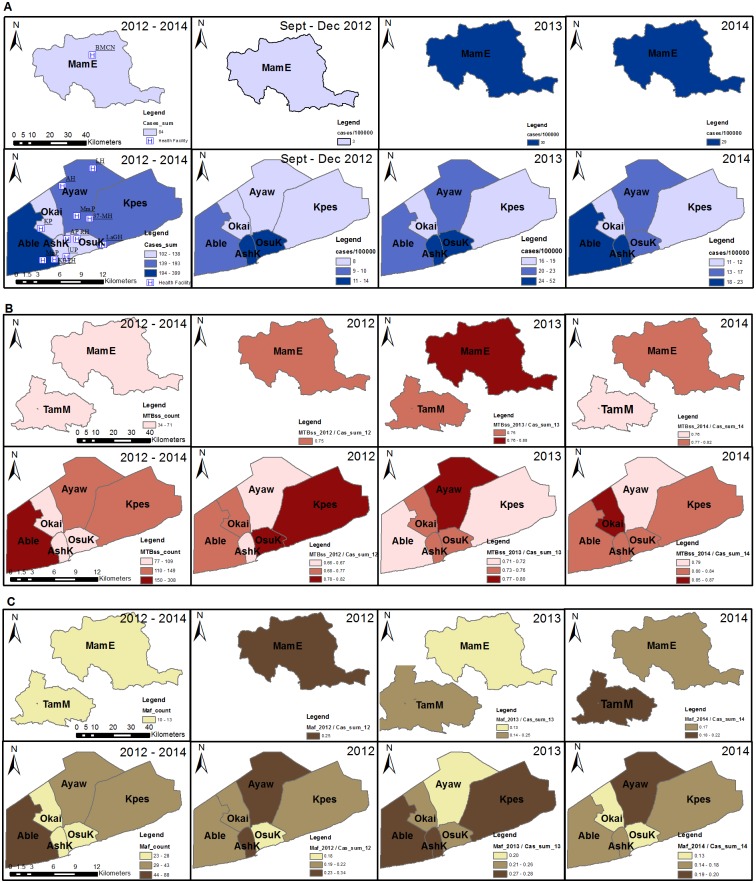
Fig 5. Spatial distribution of isolated MTBC within selected districts (2012–2014).
This figure shows the; (A) Sum and case notification rate of all TB cases from September 2012 to December 2014, (B) Sum and normalized distribution of MTBss cases, (C) Sum and normalized distribution of Maf. The total number of cases per year was used as the denominator for normalization. Sampling from TamM did not meet our criteria for being included in analyses for case notification rate and so was excluded in all columns of panel A. Likewise we also recorded no cases in 2012 as such TamM was excluded from 2012 analysis (panel B and C). This figure was created using the ArcMap program in ArcGIS v. 10.0. Abbreviations: MTBss, Mycobacterium tuberculosis sensu stricto; Maf, Mycobacterium africanum; MamE, Mamprusi East district; TamM, Tamale Metropolis; AshK, Ashiedu Keteke; Ayaw, Ayawaso; Able, Ablekuma; OsuK, Osu Klottey; Okai, Okaikoi; Kpes, Kpeshie.

