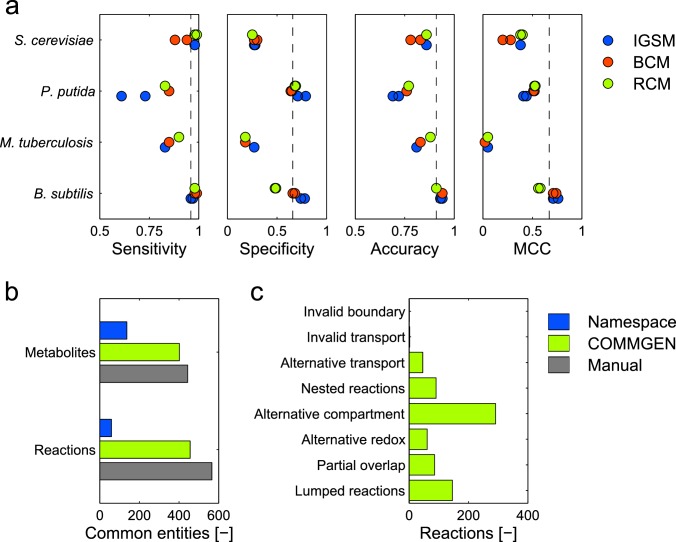
Fig 5. Performance evaluation of COMMGEN.
(a) Evaluation of GSM ability to predict growth phenotypes. Predictive ability of initial GSMs (blue), basic consensus models (red), and automatically created refined consensus model (green) according to the metrics defined in the text. The test data comprised gene knockout data (B. subtilis [3,36], P. putida [8,50], M. tuberculosis [51], S. cerevisiae [49]), biolog data (B. subtilis [3,36], P. putida [8,33]) and auxotrophies (P. putida [50]). See S3 Protocol for details. (b,c) Comparison of manual (yeast consensus model [20] based on the IGSMs iMM904 [37] and iLL672 [38]) and automatic consensus model generation with namespace matching only, or with COMMGEN. (b) Numbers of common reactions and metabolites for manual curation, name space conversion, and automatically created refined consensus model. (c) Incidences of inconsistent reaction classes identified by COMMGEN.

