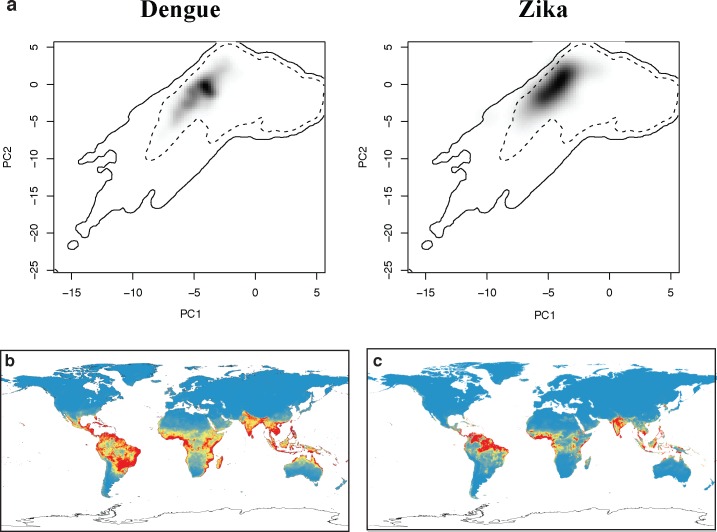
Fig 3.
The ecological niche of Zika and dengue in principal component space (a). Solid and dashed lines are 100% and 50% boundaries for all environmental data, respectively. Despite apparent overlap in environmental niche space, the dissimilarity between the black shading in each principal component graph indicates statistically significant differences between the niches, evident in the projections of our niche models for dengue (b) and Zika (c).

