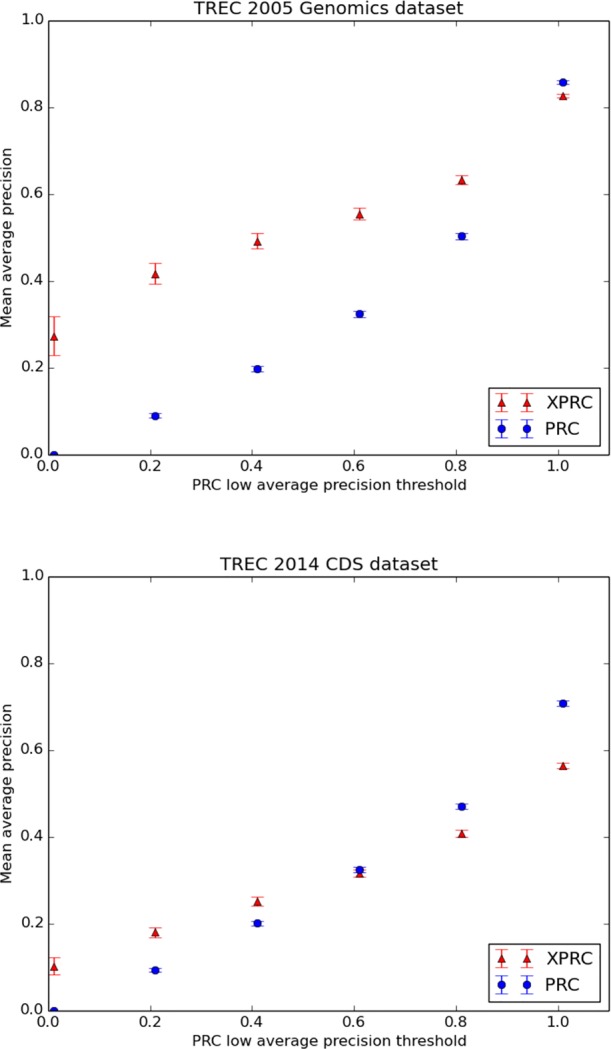
Figure 3.

A comparison of PRC and XPRC at five average precision (AP) levels determined by the PRC algorithm on the Genomics dataset and CDS dataset. For the Genomics articles in which PRC does not achieve perfect AP, XPRC has better performance in every group. For the CDS articles, XPRC achieved better performance in PRC’s low precision articles. Values of every data point are available in Tables 3 and 4. The error bars indicate standard errors.
