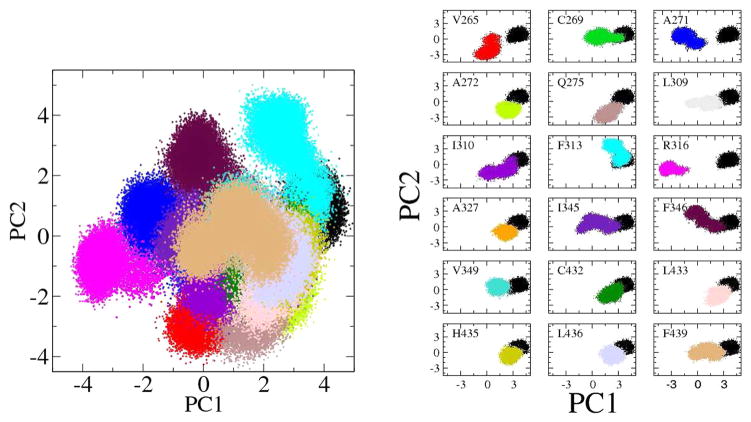
Figure 4.
Projection of all snapshots onto top PCs. The configurations of the protein–ligand complex are projected onto PC1 and PC2. Each of the 380000 points represents a specific configuration of the system obtained from a snapshot, as shown at the left. The color scheme matches that of previous figures. Each individual mutant is also displayed in a multipanel view at the right for a clear comparison with the wild type.

