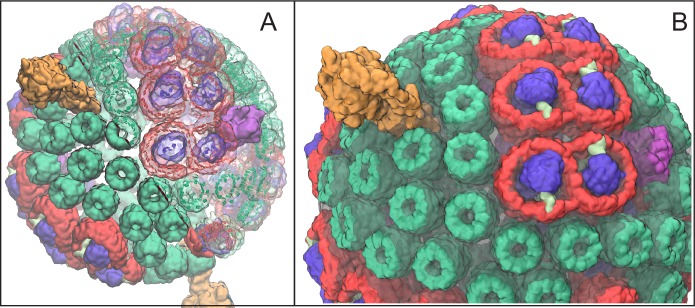
Figure 1. Atomic structural model of a low-light-adapted chromatophore vesicle from Rba. sphaeroides.
The model is based on AFM, EM, crystallography, mass spectroscopy, proteomics, and optical spectroscopy data (Cartron et al., 2014). The inner diameter of the vesicle is 50 nm. The model considered in this study is a variant of the one reported in (Cartron et al., 2014) , which features 63 LH2 complexes (green), 11 dimeric and 2 monomeric RC-LH1-PufX complexes (LH1:red; RC:blue; PufX:lime), 4 cyt (magenta), and 2 ATP synthases (orange), as well as 2469 BChls and 1542 carotenoids. Proteins are shown in surface representation. (A) Proteins and BChls of the chromatophore. Some of the light harvesting proteins are rendered transparent to reveal their BChl pigments. BChls are represented by their porphyrin rings only. See Video 1 presenting the vesicle. (B) Close-up of chromatophore showing its lipid membrane (transparent) along with its proteins colored as in (A). The membrane of 16,000 lipids contains the quinone/quinol pool of about 900 molecules. Energy conversion in the chromatophore proceeds in three stages: (I) light harvesting and electron transfer reducing the quinone pool; (II) quinone/quinol diffusion and exchange of quinols for quinones at cyt (thereby generating a proton gradient across the vesicle membrane) as well as diffusive motion of cytochrome inside the chromatophore shuttling single electrons from cyt to RC; (III) utilization of the proton gradient for ATP synthesis.

