
Figure 2. ATP production rate and energy conversion efficiency.
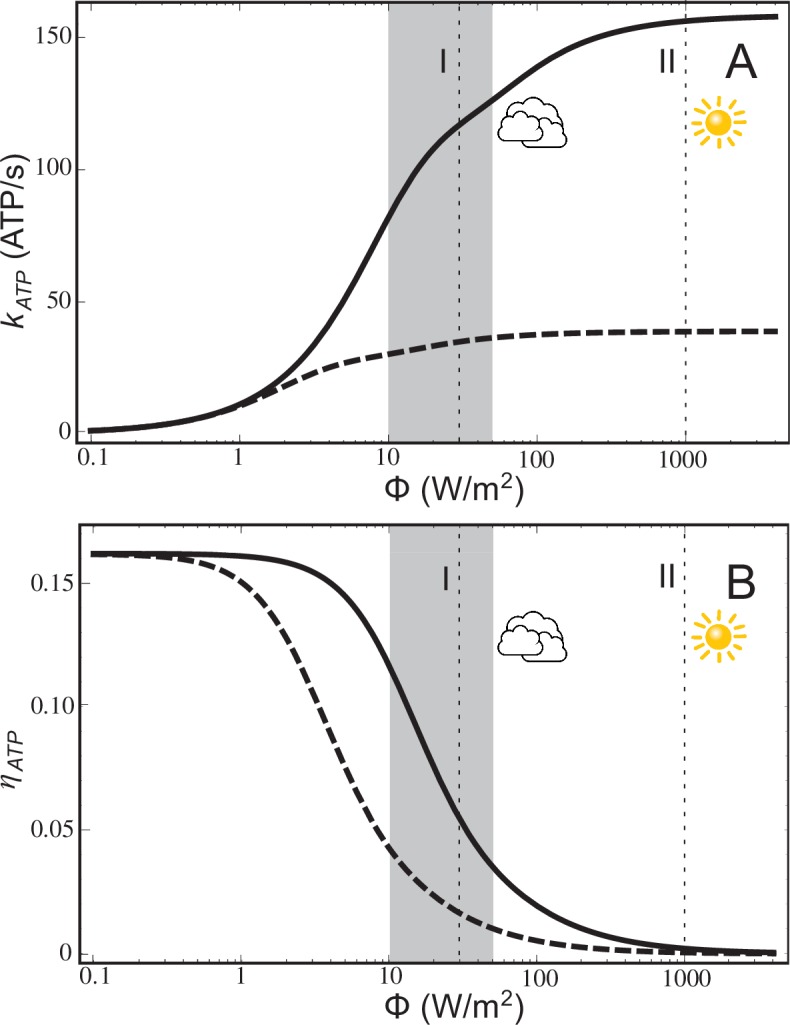
(A) Steady-state ATP production rate, , calculated according to Equation (20), and (B) energy conversion efficiency, , calculated according to Equation (21), of a chromatophore vesicle as a function of incident light intensity . Solid curves correspond to the vesicle shown in Figure 1; dashed curves represent a similar vesicle with only a single cyt. The vertical lines denote the light intensities corresponding to (I) 3% of full sunlight (30 W/m2), a typical growth condition for purple bacteria, and (II) full sunlight (1 kW/m2), respectively. Thus, for light intensities typical for the habitat of purple bacteria (1–5% of full sunlight; shaded area) the energy conversion efficiency of a chromatophore vesicle is between 0.12–0.04.