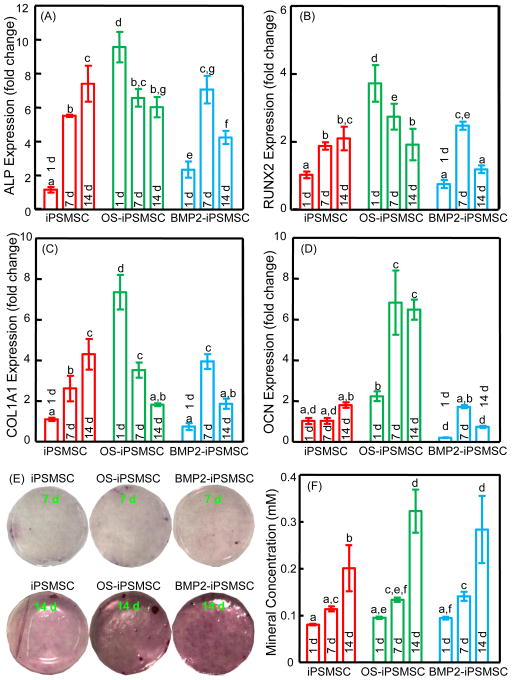
Figure 2.
Osteogenic differentiation and mineralization of the encapsulated cells in OS media. Folds of change in gene expressions for ALP (A), Runx2 (B), COL1A1 (C), and OCN (D) were plotted. The Ct value of iPSMSCs in growth media on TCPS for 1 d served as the calibrator. Mineral synthesis by cells was detected by Alizarin Red staining (E). The bone mineral matrix became denser and darker red with increasing time. Cell-synthesized mineral concentration was measured by the osteogenesis assay (F). Each value is mean ± SD (n = 5). Bars with dissimilar letters indicate signi cantly different values (p < 0.05).

