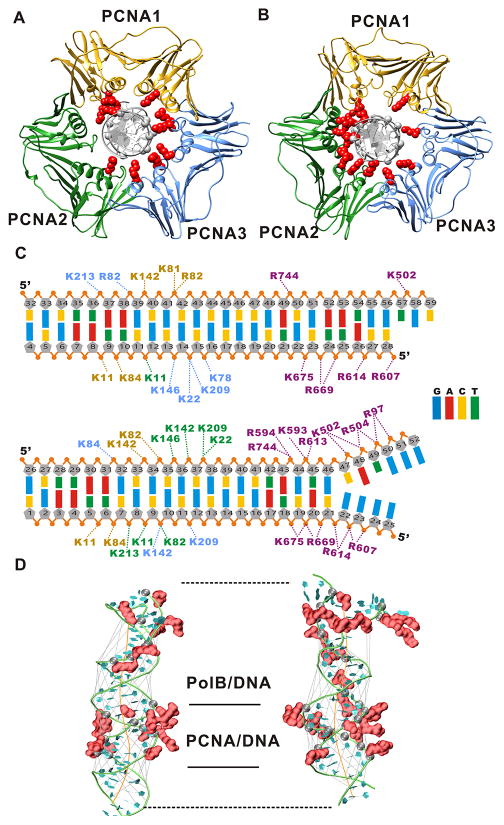
Figure 3. PolB and PCNA engage the primer-template DNA in two distinct orientations corresponding to the pol and exo modes.
(A) Binding mode of PCNA to the DNA substrate in pol mode; and (B) binding mode of PCNA to the DNA substrate in exo mode. The PCNA1 subunit is colored in gold, PCNA2 in green, PCNA3 in blue. Phosphodiester groups from the DNA and basic residues from PCNA involved in persistent contacts (present in more than 50% of trajectory frames) are shown as gray spheres and red surfaces, respectively. (C) All persistent salt-bridge contacts to the DNA are listed explicitly for pol mode (upper panel) and exo mode (lower panel). Residue labels are colored by the corresponding subunit color. (D) Structures of the DNA duplex from the pol mode (left), and the exo mode (right) simulations. The DNA is shown in ribbons representation. The DNA axis and the widths of major or minor grooves were computed with the program Curves+ and are shown in orange and gray lines respectively.

