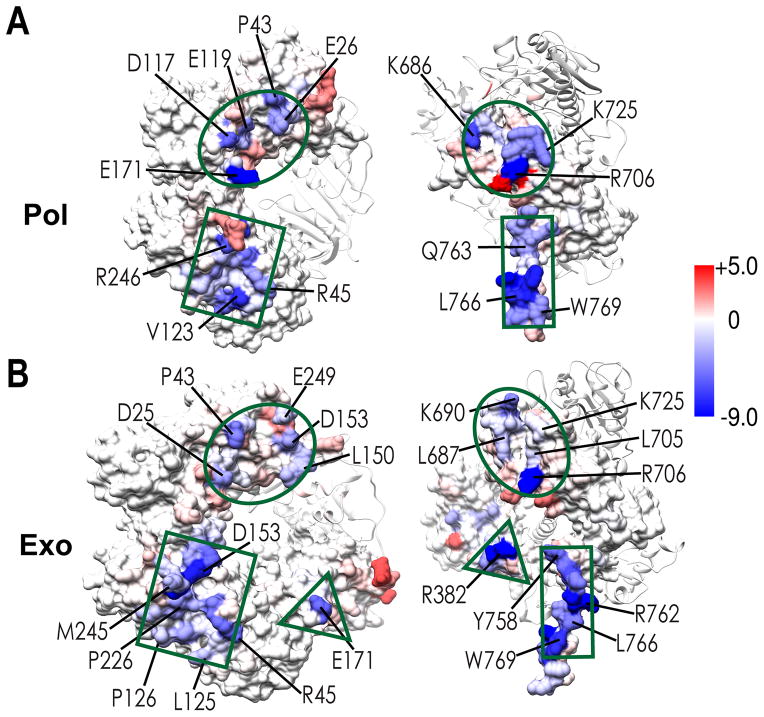
Figure 6. Binding energy contributions from individual residues at the PolB/PCNA interfaces.
Per residue binding energies computed from the one-dimensional MM/GBSA decomposition are shown in pol mode (A) and exo mode (B). Residues are colored according to the value of the binding energy in kcal/mol from red (positive) to blue (negative). The approximate locations of the three distinct PolB/PCNA interfaces are shown in green as a circle, rectangle and triangle.

