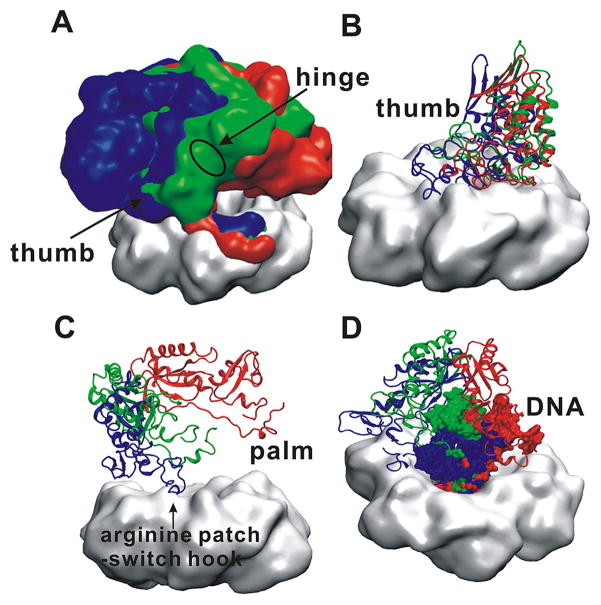
Figure 7. Targeted molecular dynamics identifies a low free energy pathway connecting the pol and exo states of the holoenzyme complex.
The pathway is represented by overlaid structures selected from the initial (red), middle (green) and final (blue) segment of the TMD trajectory. (A) Side view of the complex in surface representation; (B) Side view of the PCNA (gray surface) with the PolB thumb domain (cartoon representation); (C) View of the rotation of the PolB palm domain (cartoon representation) with respect to PCNA (gray surface); and (D) the DNA substrate (surface representation) tracking the rotational motion of the palm domain (cartoon representation).

