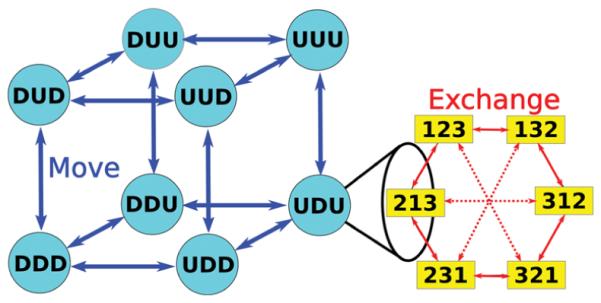
Figure 3.

Kinetic network model of RE product state space. In this picture, the nth position of the letter or number represents the metastable state or the thermodynamic state of the nth replica, respectively. The cube on the left shows the possible combinations of replicas and metastable states for a RE system with three replicas, namely, 23 = 8 vertexes. Each vertex of the cube is called an island. For example, UDU represents an island in which the 1st replica is at the “UP” metastable state, the 2nd replica is at the “DOWN” metastable state, and the 3rd replica is at the “UP” metastable state. Since exchanges cannot change the conformational state of a replica, the RE system can only travel to different islands via MD simulations (or moves) represented by blue arrows. On the right side, we show the degeneracy of one island. The states in each island are the possible permutations without repetition of replicas and thermodynamic states; therefore, there are 3! = 6 labeled states in each island. For example, “132” means the 1st replica occupies the 1st thermodynamic state, the 2nd replica occupies the 3rd thermodynamic state, and the 3rd replica occupies the 2nd thermodynamic state. The labeled states (yellow boxes in the figure above) in an island are solely connected by exchanges. Solid red arrows stand for the connections made by the nearest neighbor exchange scheme; i.e., the RE system can switch between the two labeled states connected by solid red arrows through one successful swap of the nearest neighbor exchange scheme. All red arrows, including the solid and dashed arrows, represent the connections made by the independence sampling scheme.
