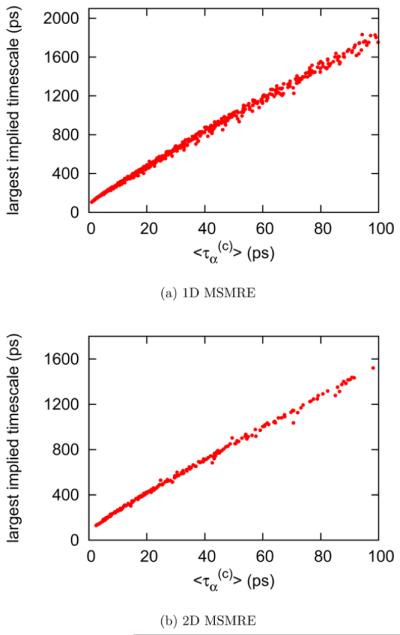
Figure 7.

Correlation between the largest implied time scale and the average lifetime. Plot a shows the correlation between the largest implied time scale and the average lifetime for ~600 one-dimensional MSMRE simulations using the independence sampling scheme, where is the average lifetime over 12 λ thermodynamic states. Plot b shows the correlation between the largest implied time scale and the average lifetime for ~200 two-dimensional MSMRE simulations using the independence sampling scheme, where is the average lifetime over the largest three λ thermodynamic states at each temperature. Both results suggest that the average lifetime is a good indicator for the sampling effciency of RE simulations which differ by the way moves and exchange attempts are packed into the replica exchange cycles.
