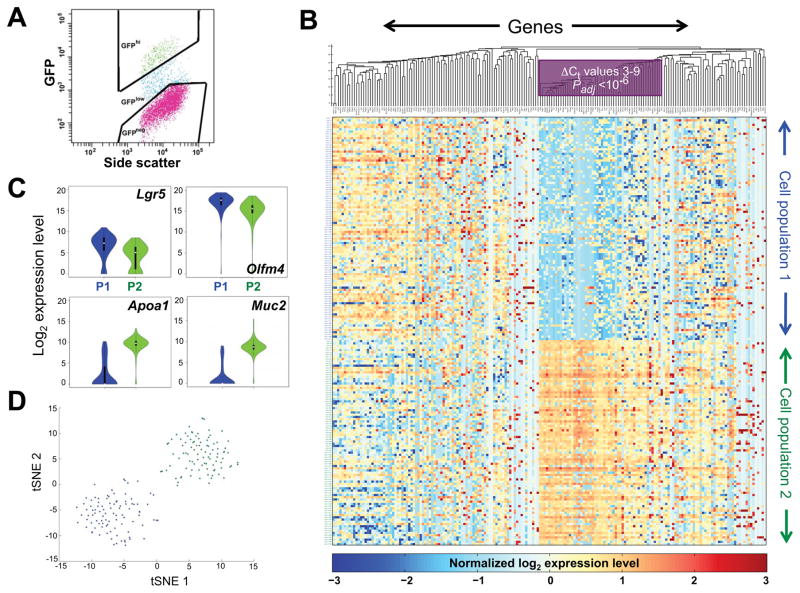
Figure 1. Targeted mRNA profiles identify two populations of Lgr5+ intestinal crypt cells.
(A) Flow cytometry plot, showing the gates applied to isolate Lgr5hi (green) cells. (B) Heatmap display of k-means (k=2) clustering of linear-transformed Ct values from 183 mRNAs (x-axis, 5 genes are represented by 2 primer sets each) in 192 single Lgr5+ intestinal crypt cells (y-axis). Blue represents absent to low, and yellow to amber colors represent increasing, transcript levels. Genes are ordered by hierarchical clustering with the average linkage method and Euclidean distance. A block of genes that best distinguishes the two cell populations, including most mature villus markers, is boxed. (C) Violin plots showing differential expression of representative stem (Lgr5, Olfm4) and differentiated (Apoa1, Muc2) cell markers in all cells in the two populations – P1 (blue) and P2 (green). (D) T-SNE analysis of the qRT-PCR data, demonstrating discrete Lgr5+ cell populations (blue, green); overlaid colors are from the adjoining k-means clusters. See also Figure S1 and Tables S1 and S2.

