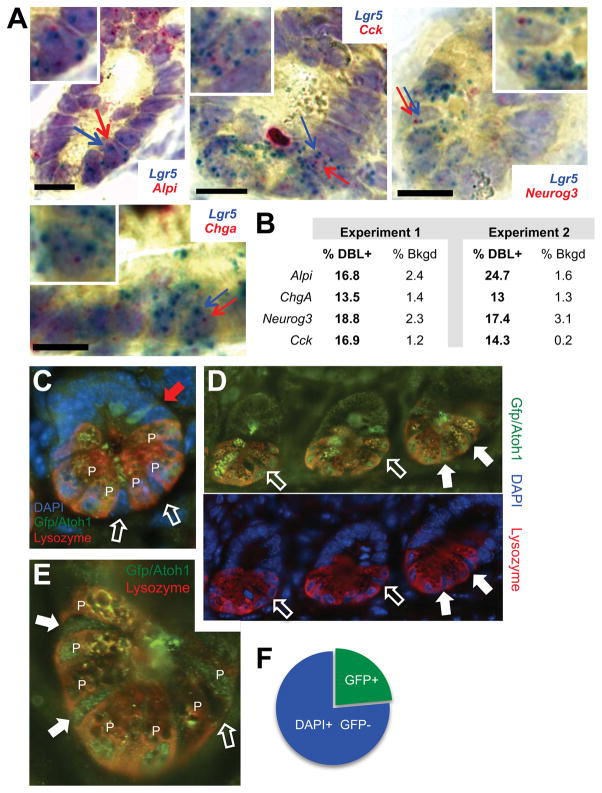
Figure 3. Expression of lineage markers in Lgr5+ crypt base cells in vivo.
(A) Representative images of single-molecule mRNA ISH for Alpi, ChgA, Cck, Neurog3 (red) and Lgr5 (blue), showing red and blue signals in the same crypt base cells. Cells with arrows pointing to co-expressed red and blue dots are magnified in the respective insets. Scale bars, 15 μm. (B) Fraction of double-positive (DBL+, red and blue) cells and background of extra-epithelial cells with red dots in intestines from 4 mice in 2 experiments. (C) Immunostaining of Atoh1Gfp/Gfp crypts with Lysozyme (red) and GFP (green) Ab and DAPI nuclear stain (blue). GFP (ATOH1) was present in Lysozyme+ Paneth cells (P) at the crypt base and in occasional TA cells (red arrow); only slim columnar cells wedged between Paneth cells (white arrows) were assessed further. (D) Absence (open arrows) or presence (filled arrows) of ATOH1 in a representative z-section of 3 consecutive crypts, with fluorescence channels separated for clarity. (E) Magnified view of a single crypt, showing that ATOH1 signals in some putative IBP are similar to those in neighboring Paneth (P) cells. (F) Fraction of ATOH1/GFP+ cells among 454 columnar DAPI+ nuclei in tiers 0–3 of Atoh1Gfp/Gfp mouse crypts. See also Figure S3.

