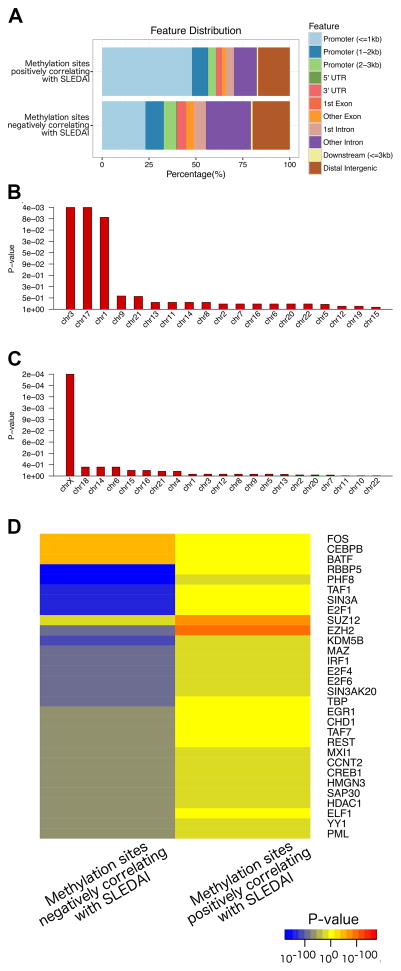
Figure 1.
Annotation of the locations of methylation sites that positively and negatively correlate with SLEDAI scores in lupus patients (upper and lower panels, respectively) relative to transcription start sites and gene structures (A). Enrichment by chromosome analysis of DNA methylation sites negatively correlated (B) and positively correlated (C) with disease activity as measured by SLEDAI scores in lupus patients. Y-axis shows FDR corrected enrichment p-values, X-axis shows chromosome numbers, sorted by most to least enrichments. (D) Heatmap of transcription factor binding sites (Y-axis) enriched in DNA methylation sites negatively and positively correlating with SLEDAI score (X-axis). Blue/yellow/red gradient shows significance of depletion/enrichment, respectively. Top 30 transcription factors most differentially enriched between the two sets of methylation sites are shown.

