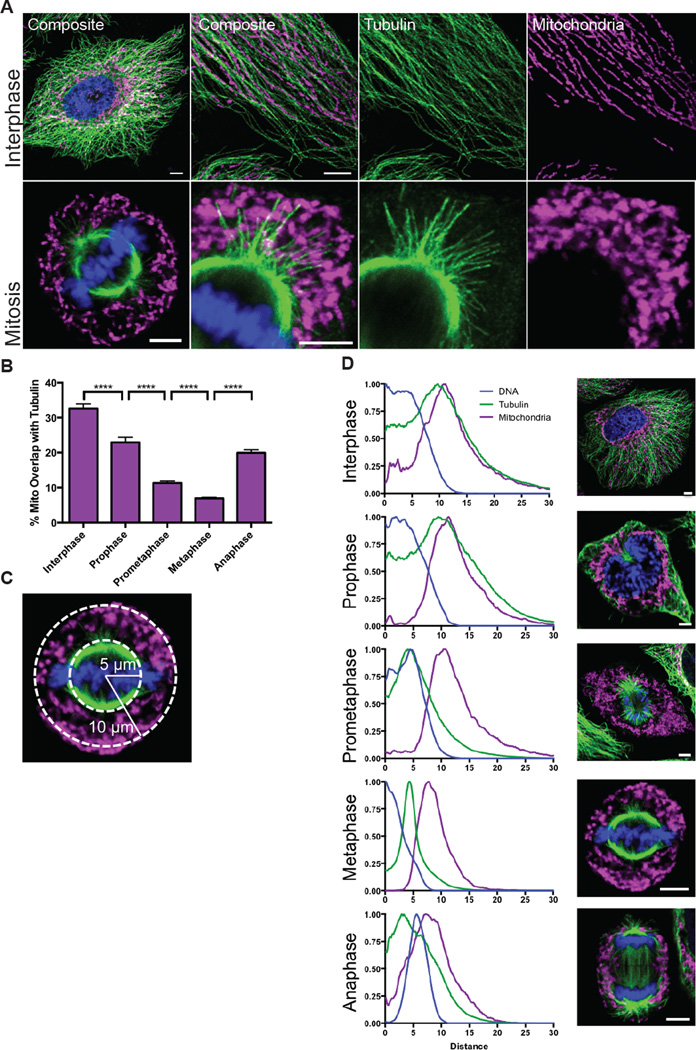
Figure 1. Mitochondria are released from microtubules during cell division.
(A) Interphase and mitotic HeLa cells were stained for TOM20 (magenta), a mitochondrial marker, tubulin (green), and DNA (Hoechst 33342, blue) and imaged by confocal microscopy at 63x and 100x. (B) Percent of the total mitochondrial area that overlapped with tubulin during each mitotic phase. (C) Schematic of how the radial distributions of tubulin and mitochondria were calculated relative to the center of the DNA. (D) The radial distributions were averaged for 30 cells for each mitotic phase. Images are representative of the phase. ****p < 0.0001; All values are shown as mean ± SEM. Scale bars represent 5 microns.

