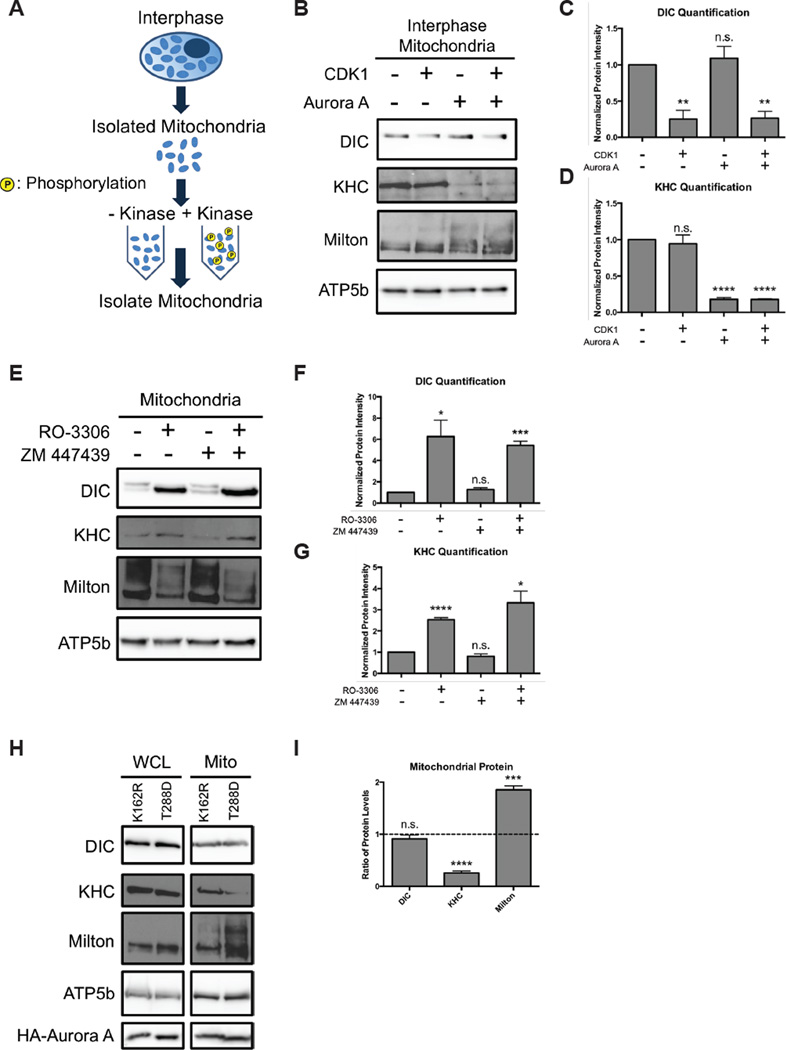
Figure 4. CDK1 and Aurora A induce motor release.
(A–D) Schematic, immunoblot, and quantification of proteins on interphase mitochondria treated with or without active, purified CDK1 and Aurora A as indicated. Dynein and kinesin band intensities were quantified and normalized to the untreated fraction condition. n = 3. (E–G) Mitotic HeLa cells were treated with the CDK1 inhibitor RO-3306 and/or the Aurora inhibitor ZM447439. Isolated mitochondria were probed for the indicated proteins. Levels of DIC and KHC were quantified and normalized to the untreated fraction condition. n = 3. (H,I) HeLa cells were transfected with inactive (K162R) or constitutively active (T288D) Aurora A kinase. Whole cell extracts (WCL) and mitochondria (Mito) were probed for the indicated proteins. Protein levels were quantified, normalized to the loading control, and then expressed as the ratio of the level in the T288D cells to K162R cells. n = 3. *p < 0.05, **p < 0.01, ***p < 0.001, ****p < 0.0001.

