
Figure 4. Distribution of tagged genotypic variance of identified SNPs at conditional FDR < 0.05.
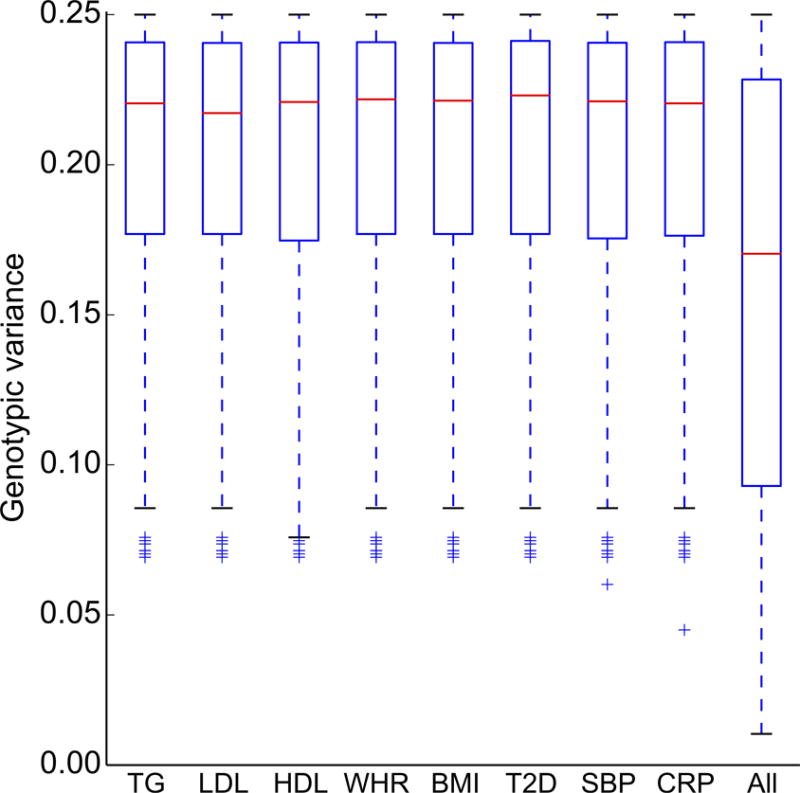
Comparison of the distribution of tagged genotypic variance (y axis) by SNPs identified by conditional FDR < 0.05 of MS conditional on cardiovascular risk factors (x axis): triglycerides (TG), Low density Lipoprotein cholesterol (LDL), High density Lipoprotein cholesterol (HDL), Waist Hip Ratio (WHR), body mass index (BMI), type 2 diabetes (T2D), systolic blood pressure (SBP) and C-reactive protein level (CRP), with all SNPs analyzed (All).