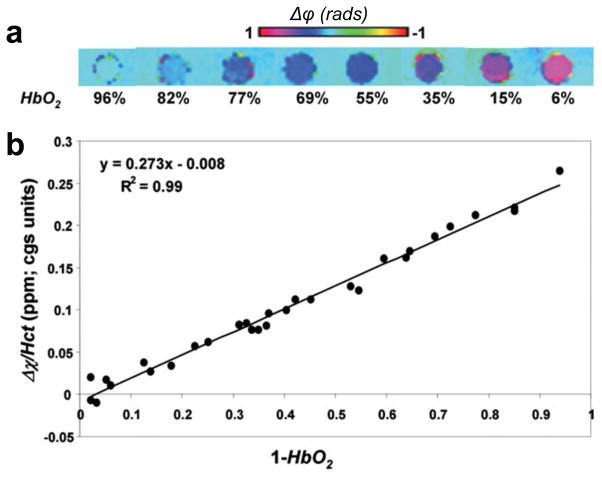
Figure 1.
a) Representative phase difference images of cylindrical sample tubes containing blood oxygenated to various HbO2 levels, oriented parallel to the B0 field and immersed in distilled water. b) Susceptibility difference (Δχ) between blood and surrounding water normalized to individual Hct level plotted against the level of deoxygenation. The slope of the regression line represents the susceptibility difference between fully oxygenated and deoxygenated blood (Δχdo) and intercept Δχoxy represents the susceptibility difference between fully oxygenated blood and water (from (19), with permission.

