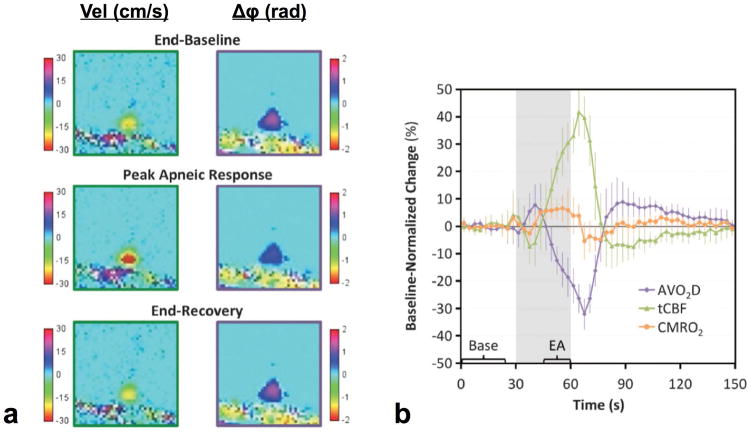
Figure 6.
Effect of volitional apnea on brain vascular-metabolic parameters: a) Expanded parametric maps of flow velocity and phase difference Δφ (for SvO2 measurement) obtained with a single-site OxFlow sequence acquiring data at the same anatomic site (SSS) at 3s temporal resolution, showing enhanced flow and increased SvO2 (manifested by reduced phase difference) during apnea. b) Fractional changes in parameter values normalized to average baseline. Error bars indicate ±1 SD, gray area the apnea period. Values in time-course plot were averaged across the three repeated blocks of the paradigm. Bracketed sections ‘Base’ and ‘EA’ indicate the data used for computing average baseline values and end-apnea values (reproduced from (55), with permission).

