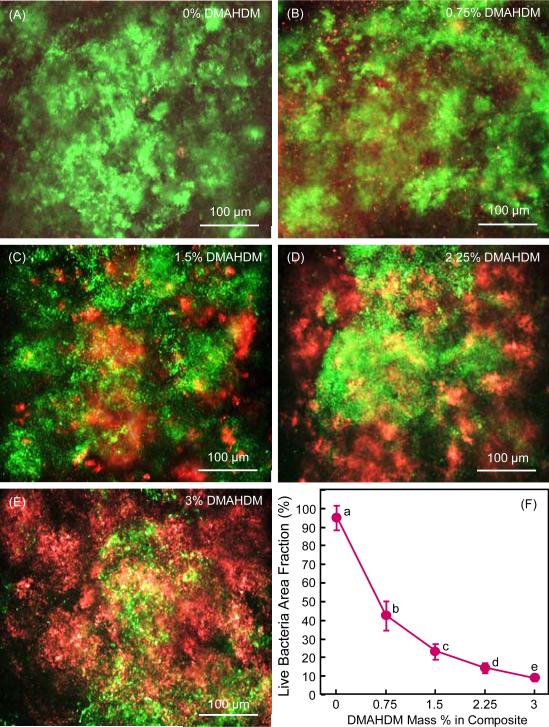
Fig. 2.
Biofilm viability: (A-E) Representative live/dead staining images of 2-day biofilms on composites, (F) Live bacteria area fraction (mean ± sd; n = 6). Live bacteria were stained green, and dead bacteria were stained red. Live and dead bacteria in close proximity of each other yielded yellow or orange colors. In (F), values with dissimilar letters are significantly different from each other (p < 0.05)

