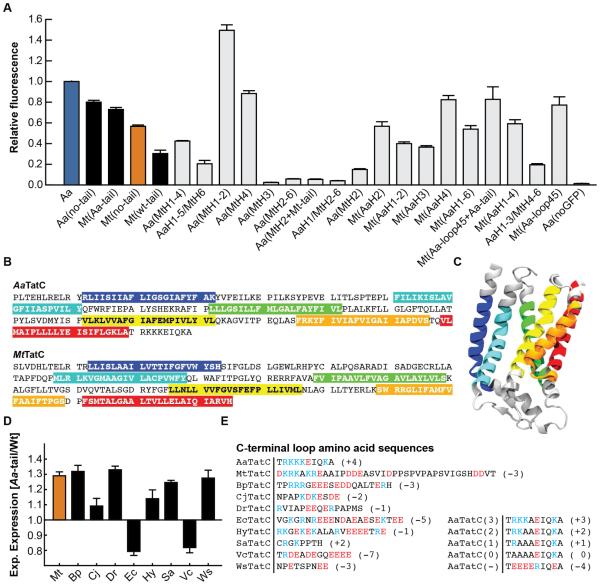
Figure 2. Effect of the C-tail on TatC expression in E. coli.
(A) Measured expression levels of the AaTatC and MtTatC chimera proteins, normalized to AaTatC. Shaded bars represent wild-type TatC homologs and mutants with C-tail modifications. (B) Domain definitions used in generating the swap chimeras, with TMDs highlighted. (C) A ribbons diagram of the structure of AaTatC (pdbID 4HTS). TMDs are colored according to the highlights used in part (B). (D) For each homolog, the ratio of the measured expression level for the Aa-tail chimera to that of the corresponding wild-type sequence. (E) TatC wild-type and charge mutant C-tail sequences. Positive residues are in blue and negative residues are in red. The net charge is shown to the right of each sequence. Error bars indicate the standard error of mean.

