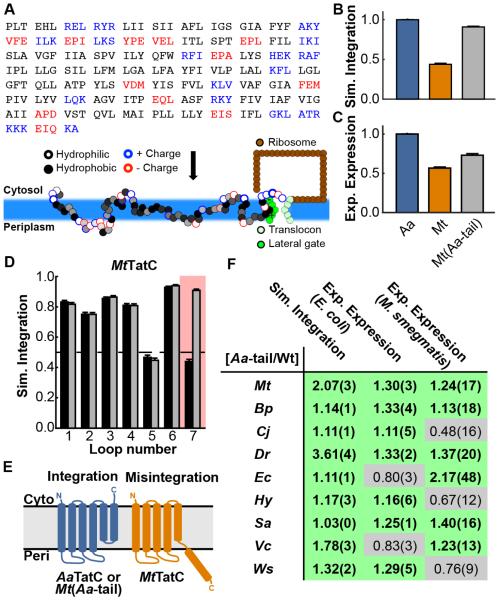
Figure 3. Calculation of TatC integration efficiencies.
(A) Schematic illustration of the CG simulation model that is used to model co-translational IMP membrane integration. The amino-acid sequence of the IMP is mapped onto CG beads, with each consecutive trio of amino-acid residues in the nascent protein sequence mapped to an associated CG bead; the underlying properties of the amino-acid residues determine the interactions of the CG beads, as described in the text. (B) Simulated integration efficiency of the AaTatC, MtTatC, and Mt(Aa-tail) sequences. (C) Experimental expression of the AaTatC, MtTatC, and Mt(Aa-tail) sequences. (D) The simulated integration efficiency for individual loops of both the wild-type MtTatC sequence (black bars) and the Aa-tail swap chimera (grey bars), with loop 7 highlighted. (E) Schematic of the correct and incorrect TatC topologies observed in the simulations; misintegration of loop 7 and translocation of TMD 6 leads to an incorrect final topology for MtTatC. Error bars indicate the standard error of mean. (F) For each homolog, comparison between the experimental expression levels in E. coli and M. smegmatis and the simulated integration efficiencies, reporting the ratio of the Aa-tail chimera result to that of the corresponding wild-type sequence. Ratios exceeding unity are highlighted in green, indicating enhancement due to the Aa-tail. Values in parentheses indicate the standard error of mean. See also Figure S4.

