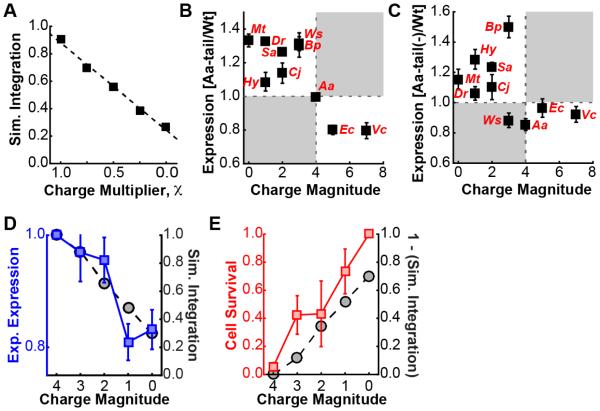
Figure 5. Mechanistic basis associated with charged C-tail residues.
(A) Simulated integration efficiency of the Mt(Aa-tail) chimera, as a function of scaling the charges of the C-tail residues. (B) Correlation of the ratio of the measured expression for the Aa-tail swap chimeras to that of the corresponding wild-type sequence versus the charge magnitude of the wild-type C-tail (data from Figure 2B and Figure 2E). Linear regression yields a fit of R = −0.8±0.2. (C) Correlation of the ratio of the measured expression for the Aa-tail(−) swap chimeras to that of the corresponding wild-type sequence versus the charge magnitude of the wild-type C-tail, where the Aa-tail(−) swap chimeras include a variant of the Aa-tail with net negative charge and the same overall charge magnitude. (D) Experimental expression levels in E. coli (blue, left axis) and simulated integration efficiency (black, right axis) for a series of mutants of the Mt(Aa-tail) sequence, in which positively charged residues in the Aa-tail are mutated to alanine residues. Reported values are normalized to Mt(Aa-tail). (E) Relative ampicillin survival rate in E. coli (red, left axis) and simulated integration efficiency (black, right axis) for a series of mutants of the Mt(Aa-tail) sequence, in which positively charged residues in the Aa-tail are mutated to alanine residues. Simulation results are normalized as in part (d), while ampicillin survival is normalized to the highest survival rate (i.e., with zero charge magnitude). Error bars indicate the standard error of mean.

