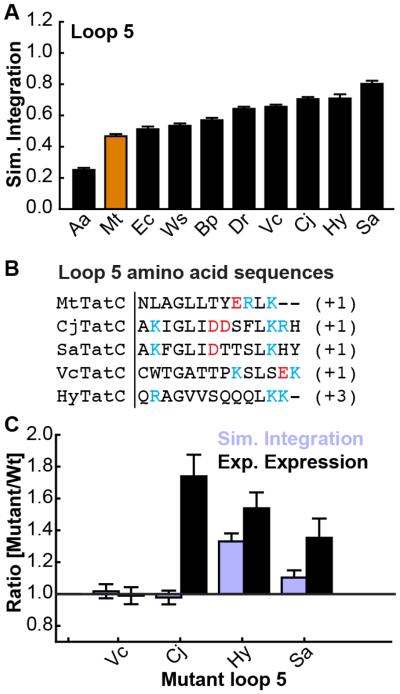
Figure 7. Loop 5 analysis for MtTatC.
(A) Simulated integration efficiency of loop 5 for the TatC homologs. (B) Loop 5 amino-acid sequence for various TatC homologs. (C) Experimental expression (black) and simulated integration efficiency (purple) for the loop 5 swap chimeras of MtTatC in which the entire loop 5 sequence of wild-type MtTatC is replaced with the corresponding sequence of other homologs. Error bars indicate the standard error of mean.

