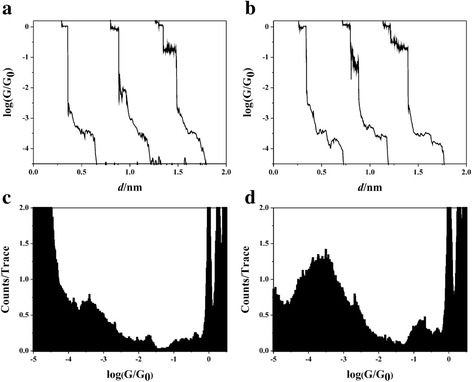
Fig. 2.

Single-molecule conductance histograms of pentanedioic acid and glutaraldehyde. A log-scale conductance curves of a Cu-glutaraldehyde-Cu junctions and b Cu-1,4-benzenedicarboxaldehyde-Cu junctions. Log-scale conductance histogram of c Cu-glutaraldehyde-Cu junctions and d Cu-terephthalaldehyde-Cu junctions
