Fig. 4.
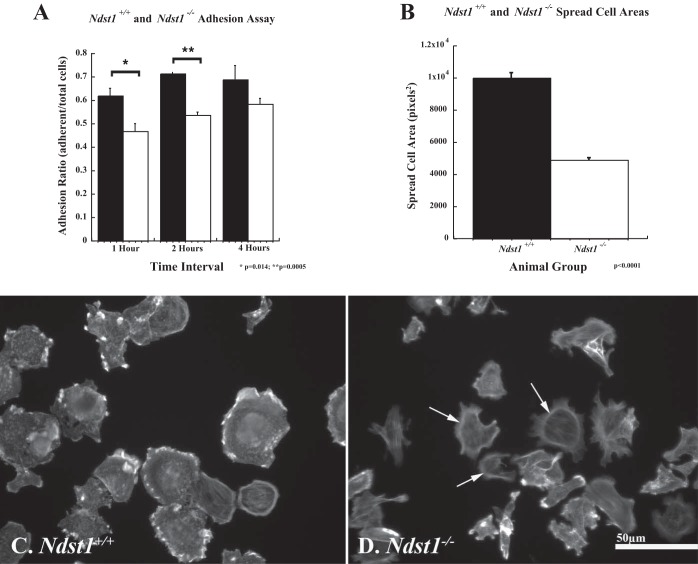
Ndst1−/− podocytes do not attach and spread as efficiently on fibronectin compared with Ndst1+/+ podocytes. The graphs show the results of the cell adhesion assay (A) and spread cell area measurements (B) for Ndst1+/+ and Ndst1−/− podocytes in culture. A: differences in adhesion of Ndst1−/− podocytes on fibronectin at 1, 2, and 4 h. A significant difference was observed in Ndst1−/− podocyte adhesion (white bars) to fibronectin at 1 (P = 0.014) and 2 (P = 0.0005) h after seeding compared with Ndst1+/+ podocytes. A similar but not significant difference in adhesion was observed at 4 h after seeding between Ndst1+/+ and Ndst1−/− podocytes. B: results of spread cell area measures at T = 2 h after seeding between Ndst1+/+ (white bars) and Ndst1−/− (black bars) podocytes, the Ndst1−/− cells showing a twofold difference (P = 0.0001) in area compared with Ndst1+/+ cells. C and D: Ndst1+/+ and Ndst1−/− podocytes stained with Alexa 488 phalloidin to demonstrate differences in actin organization at 2 h after seeding. Prominent clusters of actin can be seen around the periphery of the Ndst1+/+ cells (C) and some cells show the beginning of stress fiber formation. The Ndst1−/− cells (D) show less spreading and fewer clusters of actin around their periphery, some still retaining a pattern of cortical actin staining. Final magnification in C and D: ×400, bar = 50 μm.

