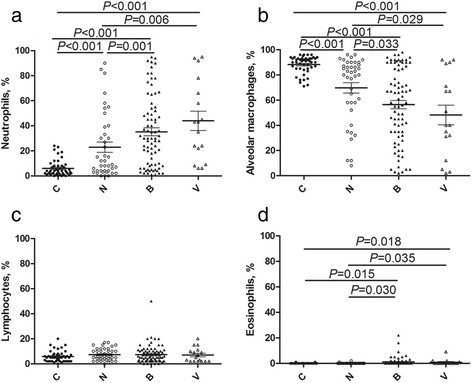
Fig. 1.

BAL cellular content. The percentages of neutrophils (a), alveolar macrophages (b), lymphocytes (c) and eosinophils (d) in the BAL in the control (C, n = 46), non-pathogen (N, n = 40), bacterial-infection (including M. pneumoniae) (B, n = 78), and virus-infection groups (V, n = 17). Horizontal bars indicate the median for each group of patients
