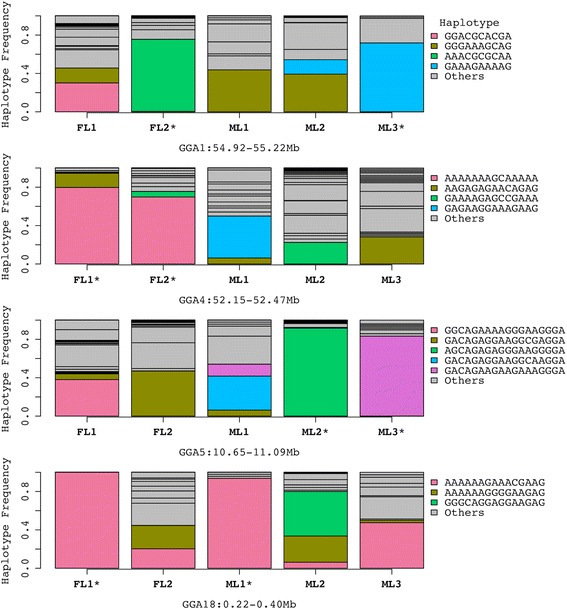
Fig. 3.

Haplotype frequencies of SNPs in four selection regions detected in multiple purebred lines of broiler chickens. The various colors excluding grey refer to the major haplotypes identified in the 5 purebred lines. At each denoted region, a selection signature was detected in the purebred lines marked with “*”
