Fig. 2.

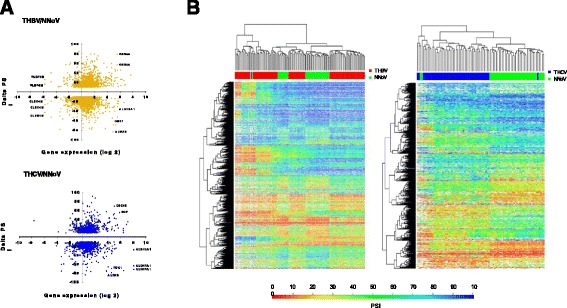
Global profiling of alternative splicing event modifications in HBV- and HCV-associated HCC. a Alternative splicing event modifications in HBV-associated HCC (THBV/NNoV) and HCV-associated HCC (THCV/NNoV) are presented with their associated changes in gene expression. The graphs represent the relation between the difference of splicing for each hepatitis-associated HCC compared with healthy non-viral tissues, and the difference in gene expression for each of these alternative splicing event modifications. b Heatmap representations of isoform ratios (PSI values) for all tissues analyzed in the current study. The first heat map shows PSI values for HBV-associated HCC. HBV-associated HCC tissues (THBV) are shown in red, and the comparative healthy tissues are shown in green (NNoV). The second heat map shows PSI values for HCV-associated HCC. HCV-associated HCC tissues (THCV) are shown in blue, and the comparative healthy tissues are shown in green (NNoV)
