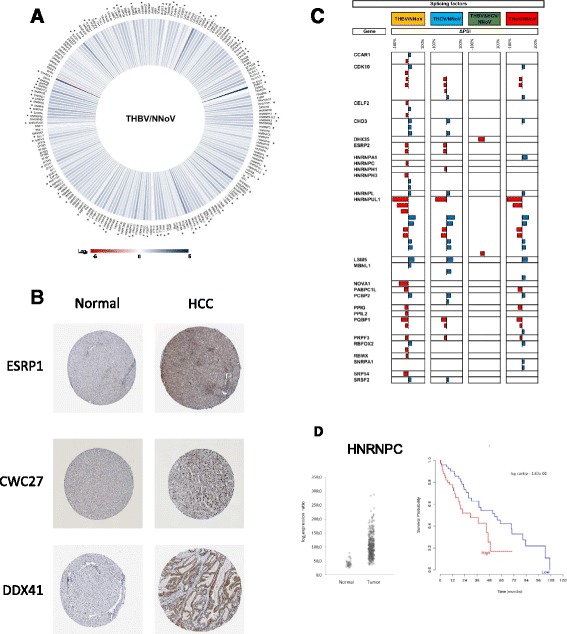
Fig. 6.

RNA splicing factors in HCC. a Iris Graph representing the expression profile of splicing factors for HBV-associated HCC. Differences in gene expression levels are shown on a logarithmic color scale (Log2), from red (negative changes in expression) to blue (increase in gene expression). b Expression of splicing factors in both normal liver tissues and hepatocellular carcinomas. These images were extracted from the Human Protein Atlas database, according to its academic usage permission (see Ref. [65] and www.proteinatlas.org). The images show the results of immunohistochemical staining using specific antibodies (complete list and experimental protocol found at www.proteinatlas.org), followed by detection with horseradish peroxidase. Immunohistochemical staining was performed on both normal and HCC tissues for three different splicing factors (ESRP1, CWC27, and DDX41). c Misregulation of splicing factors alternative splicing in HBV- (THBV/NNoV, yellow), HCV- (THCV/NNoV, blue), HBV&HCV- (THBV&HCV/NNoV, green) and virus-free HCC (TNoV/NNoV, red). The delta PSI values are represented in red (negative delta PSI values) and in blue (positive delta PSI values). d Expression levels of hnRNPC in patients with or without tumors (left panel). Kaplan–Meier overall survival curve (right panel) for HCC patients expressing high (red) or low (blue) levels of hnRNPC. HNRNPC transcript level was negatively correlated with overall survival
